
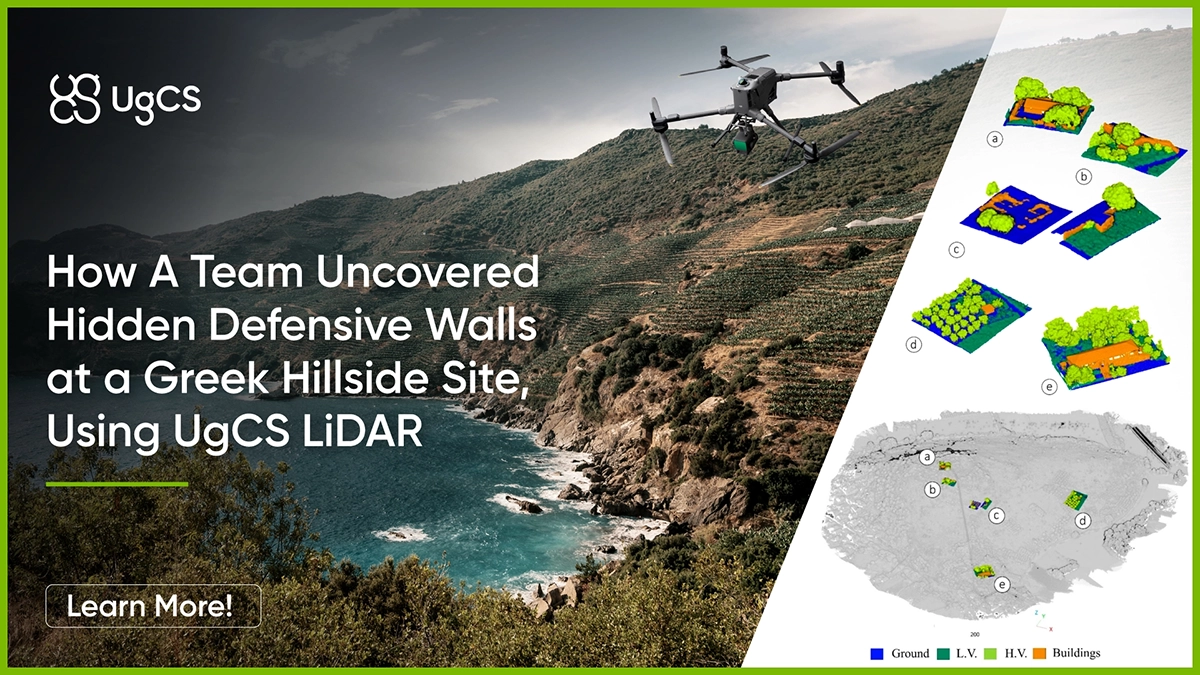
A drone LiDAR survey solves that problem. A laser pulse reaches the ground through gaps in a leaf canopy that block a camera, so a dense enough scan can reconstruct the terrain and any walls or structures hidden beneath the vegetation.
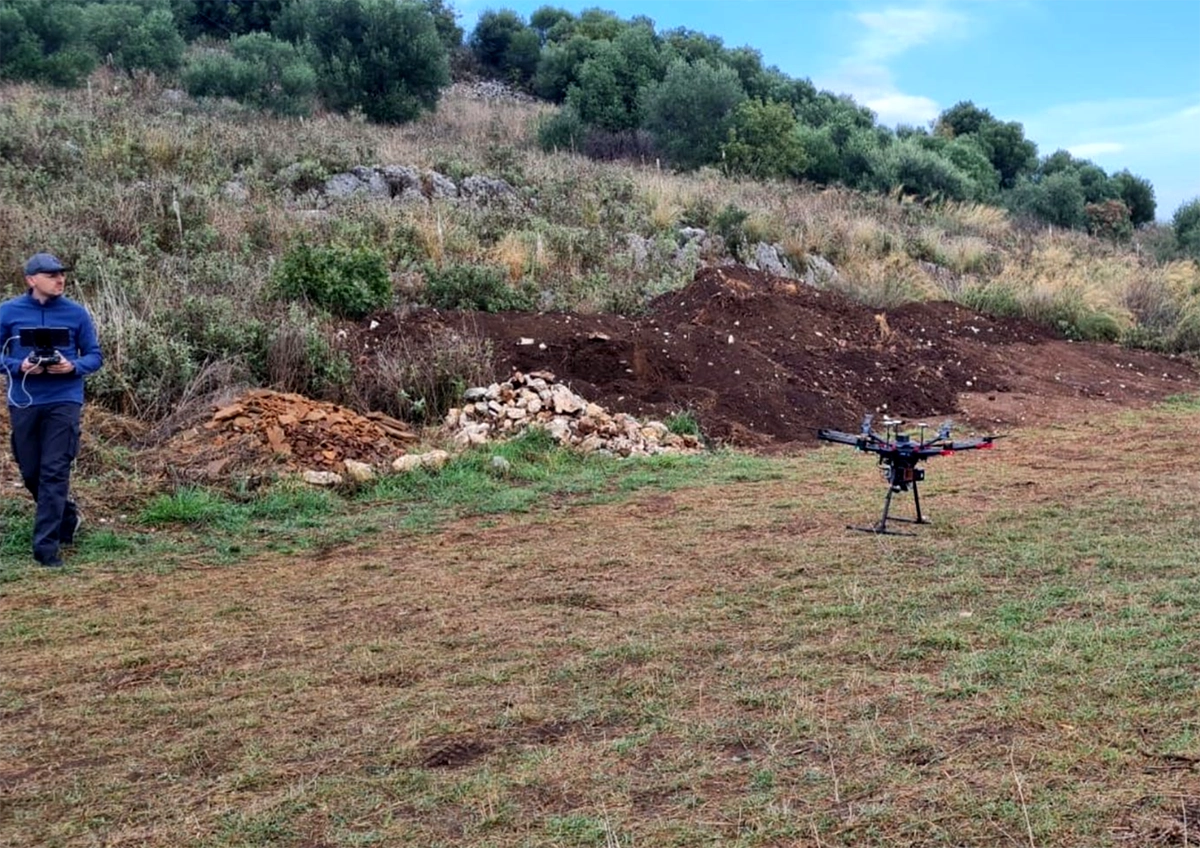
Getting that scan meant flying a UAS LiDAR payload, a Riegl MiniVux-3 laser scanner, over roughly 65 hectares of sloped, uneven, scrub-covered hillside, and keeping it close enough to the ground the whole way for the scan to come out evenly dense. That's where UgCS flight planning software came in.
- UgCS Expert flew the LiDAR-carrying drone in Terrain Follow mode, holding the DJI Matrice 600 and its Riegl scanner at a constant 70 meters above the actual ground surface, as the hill rose and fell beneath it.
- UgCS also flew the survey as a dual grid, covering the same 65 hectares along two overlapping sets of flight lines instead of one, a pattern generally used to cut down on the blind spots a single flight direction leaves under thick vegetation.
Flying at a constant 3 meters per second, the mission produced an average of about 2,000 measurement points per square meter across the site. That density is what let the researchers' later processing steps, a machine-learning classifier and a set of terrain visualization tools, tell ground, vegetation, and buildings apart well enough to map walls the scrub had hidden for centuries.
The same combination, a terrain-following flight height plus a dual-grid coverage pattern, applies to any survey that needs consistent point density over rough or vegetated ground: forestry and canopy work, mining slopes, landslide sites, or other heritage sites where the target is buried under vegetation rather than sitting in the open.
Institution: CNR-ISPC (Institute of Heritage Science, National Research Council), Italy, in collaboration with the Ephorate of Antiquities of Preveza, Greece; the University of Basilicata, Italy; and CNR-IMAA (Institute of Methodologies for Environmental Analysis), Italy.
Key Results
- A LiDAR survey of a 65-hectare scrub-covered hillside revealed three concentric defensive walls that ground survey and aerial photos hadn't fully mapped.
- The machine-learning classifier sorted ground, vegetation, and buildings with 85.03% overall accuracy, using only open-source software and no programming.
- UgCS held the LiDAR-carrying drone in Terrain Follow mode at a constant 70 m above ground, flying a dual-grid pattern across the whole hillside.
- The resulting point cloud averaged about 2,000 points per square meter, dense enough to resolve buried walls, terracing, and access routes under the scrub.
Why 65 Hectares of Mediterranean Scrub Blocked a Full Ground Survey
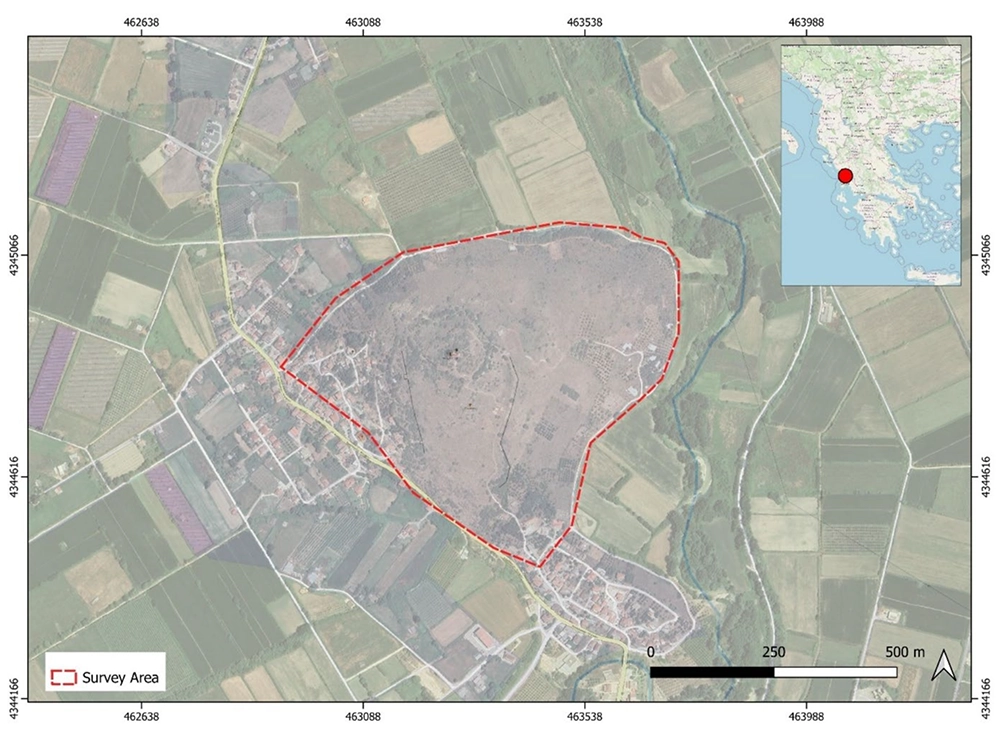
Kastrì-Pandosia sits on a hill in Epirus, in northern Greece, a settlement founded in the third century BC and reoccupied through the medieval period into the fifteenth century. Excavations that began in the 1990s and expanded after 2019 had already uncovered a fortified Hellenistic residential complex, a medieval wall circuit with towers, and a Byzantine church on the acropolis.
What nobody had was a complete picture of the ground above those excavated trenches. Most of the hill is covered in dense Mediterranean scrub, thick and rough enough that a full walking survey of the site is slow, difficult, and in places unsafe.
Why Point Cloud Classification Usually Costs Money or Code
LiDAR sees through vegetation that blocks a camera, which is why it has become a standard tool for archaeological prospection on overgrown sites. But turning a raw LiDAR point cloud into a usable archaeological map has its own cost. Commercial classification software is expensive, and the free alternative, deep-learning tools, generally needs programming skills most archaeology teams don’t have on staff.
The researchers wanted a workflow that skipped both problems: fly the LiDAR, classify the point cloud, and produce a clean map of ground, vegetation, and structures, using tools that are free and don’t require writing code.
All of it depends on the quality of the scan underneath. That meant flying the sensor across close to 65 hectares of sloped ground and uneven canopy, holding a tight altitude band above the actual ground surface so the scan came out evenly dense.
How Terrain Follow Mode Kept Point Density Even Across the Hillside
UgCS allowed the team to fly the Riegl MiniVux-3 scanner over the hill in Terrain Follow mode, holding the DJI Matrice 600 at a constant 70 m above the ground surface itself, not a fixed altitude above sea level, as the terrain rose and fell beneath it. The mission also utilised a double-grid pattern, covering the same area along two overlapping sets of flight lines instead of one.
UgCS’s job here was the flight itself: getting the scanner over the whole hill while following the terrain at a steady 3 m/s so the point cloud came out with even density everywhere, about 2,000 points per square meter on average. Sorting those points into ground, vegetation, and buildings, and reading the result as archaeology, happened afterward in CloudCompare, RVT, and QGIS. UgCS did not do the classification or the interpretation; it got the sensor over the site well enough that the classification had good data to work with.
Drone, LiDAR Sensor, and Open-Source Processing Pipeline
- Site: Kastrì-Pandosia hillside settlement, Epirus, Greece. LiDAR survey area of approximately 65 hectares.
- LiDAR sensor: Riegl MiniVux-3, a 5-echo time-of-flight laser scanner with GNSS post-processed kinematic (PPK) positioning, flown as a payload on a DJI Matrice 600.
- Flight parameters (UgCS Expert): 70 m above ground level, constant speed of 3 m/s, dual-acquisition grid mode, Terrain Follow mode active.
- Point cloud density: approximately 2,000 points per square meter, averaged across the site.
- GNSS correction: route corrected against Greek national GNSS fixed stations using Applanix POSPac v8.7 UAV software; point cloud generated and exported to WGS 84 UTM 34N using Riegl's RiPROCESS suite.
- Companion photogrammetric survey (not flown with UgCS): DJI Matrice 300 RTK with a 42-megapixel DJI P1 RGB camera, flown at 120 m AGL via the DJI Pilot app with its own terrain-follow function, 1,900 photographs, processed in OpenDroneMap WebODM (v2.8.0) into a georeferenced orthophoto at 0.9 cm/pixel resolution, average error 0.017492 m. Used to color the LiDAR point cloud, not part of the LiDAR flight itself.
- Point cloud preparation: Noise Filter and Statistical Outlier Removal (k = 8, σ = 2) applied in CloudCompare, then resampled to a 0.1 m minimum point spacing.
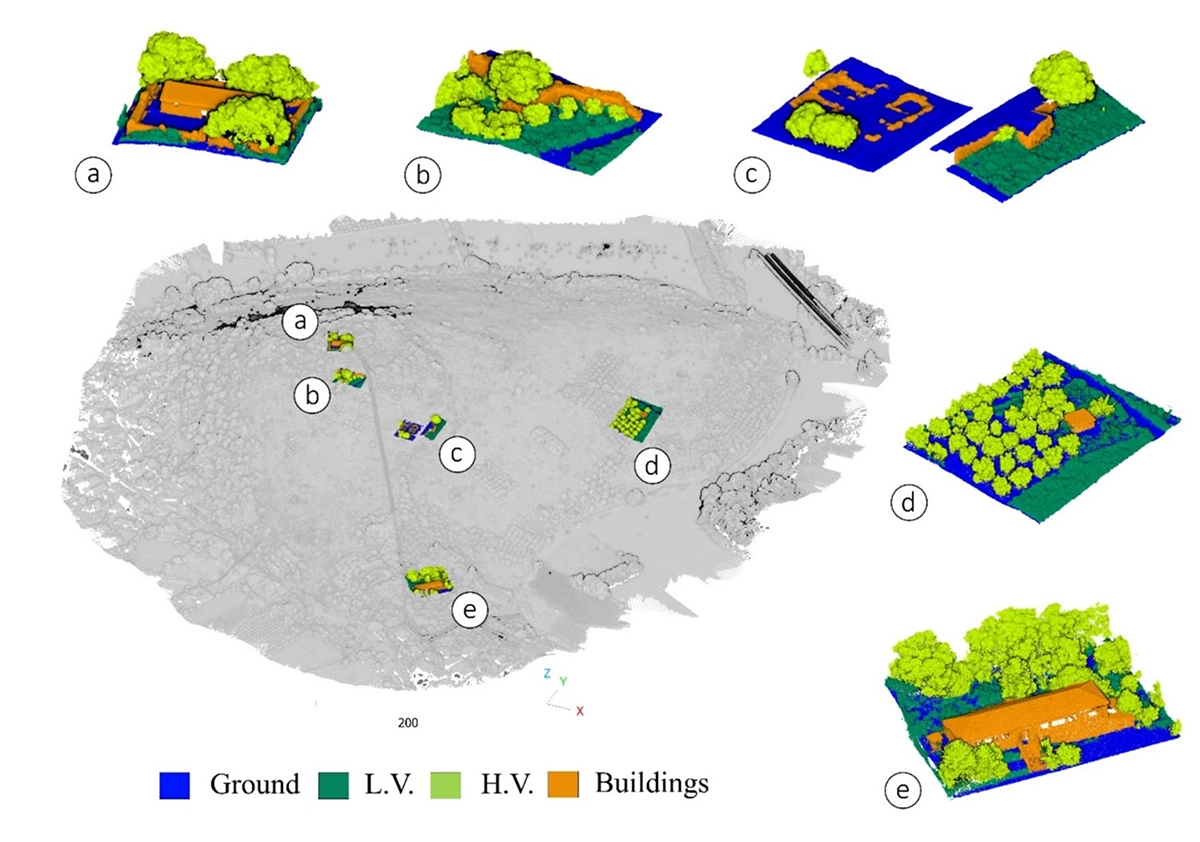
- Classification: CloudCompare (v2.14) with its 3DMASC plugin, using a Random Forest classifier trained on 4 manually labelled ASPRS (American Society for Photogrammetry and Remote Sensing) classes (ground, low vegetation, high vegetation, buildings), computed across 17 geometric and spectral features at 8 spatial scales (0.2 to 1.6 m radius). Ten hyperparameter combinations were tested; the best (250 trees, maximum depth 25, minimum leaf count 10) reached 85.03% overall accuracy.
- Terrain visualization: digital terrain models (DTM) and feature models exported at 0.2 m/pixel resolution, noise-reduced with an Enhanced Lee filter, then processed through nine Relief Visualisation Toolbox (RVT v2.2.1) derivatives, including hillshade, slope gradient, simple local relief model (SLRM), sky-view factor, positive and negative openness, and local dominance.
- Final mapping: all outputs combined in QGIS (v3.34.14) for archaeological interpretation.
What the Classified Point Cloud Revealed at Kastrì-Pandosia
- The classifier told ground, vegetation, and buildings apart with 85.03% overall accuracy, the best of ten parameter combinations tested (250 trees, maximum tree depth 25, minimum leaf count 10).
- Ground and high vegetation classified best. Both reached precision and recall above 0.85, meaning the model rarely confused solid ground or tall vegetation with anything else.
- Low vegetation was the hardest class to pin down, with recall around 0.53, the model’s weakest spot. Low scrub cover is the class most likely to get mixed up with ground or buildings in this kind of terrain.
- The point cloud averaged about 2,000 points per square meter across the full 65-hectare site, dense enough to resolve subtle wall remains and buried structures the vegetation had hidden.
- Three concentric defensive walls emerged from the data, protecting different areas of the ancient settlement, information the researchers say significantly expands on what ground survey and RGB orthophoto analysis alone had shown.
- A large quadrangular structure near the hilltop’s St. John Church appeared almost entirely in the LiDAR data, with only a small portion of it visible on the surface.
- Terracing, probable quarry fronts, and access paths across the site also showed up in the derived terrain models, none of them clearly visible in the RGB orthophoto.
Ground Survey and RGB Orthophoto Compared With Drone LiDAR
Limits of the Classifier and Where the Workflow Goes Next
The authors are direct about what the classifier still can't do: without further, more complex processing, it labels anything matching certain building-like geometry as a building, whether the structure is ancient or a modern rooftop nearby. Telling the two apart currently depends on an archaeologist reading the result, not the model itself.
Some of the features flagged in the LiDAR data have been checked on the ground, but much of the site remains too vegetated, rough, or unsafe to fully validate underfoot, so parts of the map still rest on interpretation rather than physical confirmation. What the survey maps is surface and near-surface topography, and confirming what lies below it is a separate question that drone LiDAR surveys in archaeology generally answer by adding subsurface sensors. The authors also note the approach isn't specific to archaeology under vegetation; the same open-source pipeline applies to any point cloud data, including bathymetry.
Source: Abate, N., Roubis, D., Aggeli, A., Sileo, M., Minervino Amodio, A., Vitale, V., Frisetti, A., Danese, M., Arzu, P., Sogliani, F., Lasaponara, R., & Masini, N. (2025). An Open-Source Machine Learning–Based Methodological Approach for Processing High-Resolution UAS LiDAR Data in Archaeological Contexts: A Case Study from Epirus, Greece. Journal of Archaeological Method and Theory, 32, Article 38. https://doi.org/10.1007/s10816-025-09706-8. Accepted March 20, 2025; published online April 1, 2025. Peer-reviewed, open access under CC BY 4.0.
Research funded by: The PANDOSIA project (winner of the European Call 2023 for access to E-RIHS mobile laboratories, used for the LiDAR data acquisition and processing) and the CHANGES project (Italy's National Recovery and Resilience Plan, Mission 4, Component 2, Investment Line 1.3 “Extended Partnerships,” Spoke 5, WP3), for the post-processing and machine-learning application. Open-access costs covered by CNR under the CRUI-CARE Agreement.

