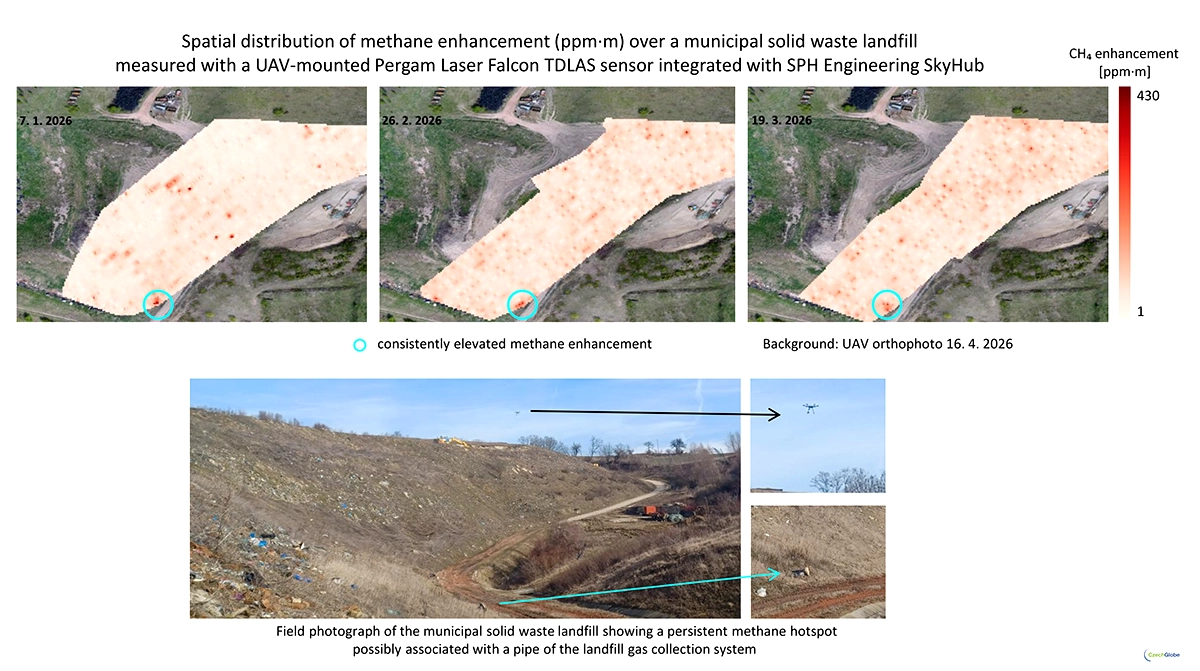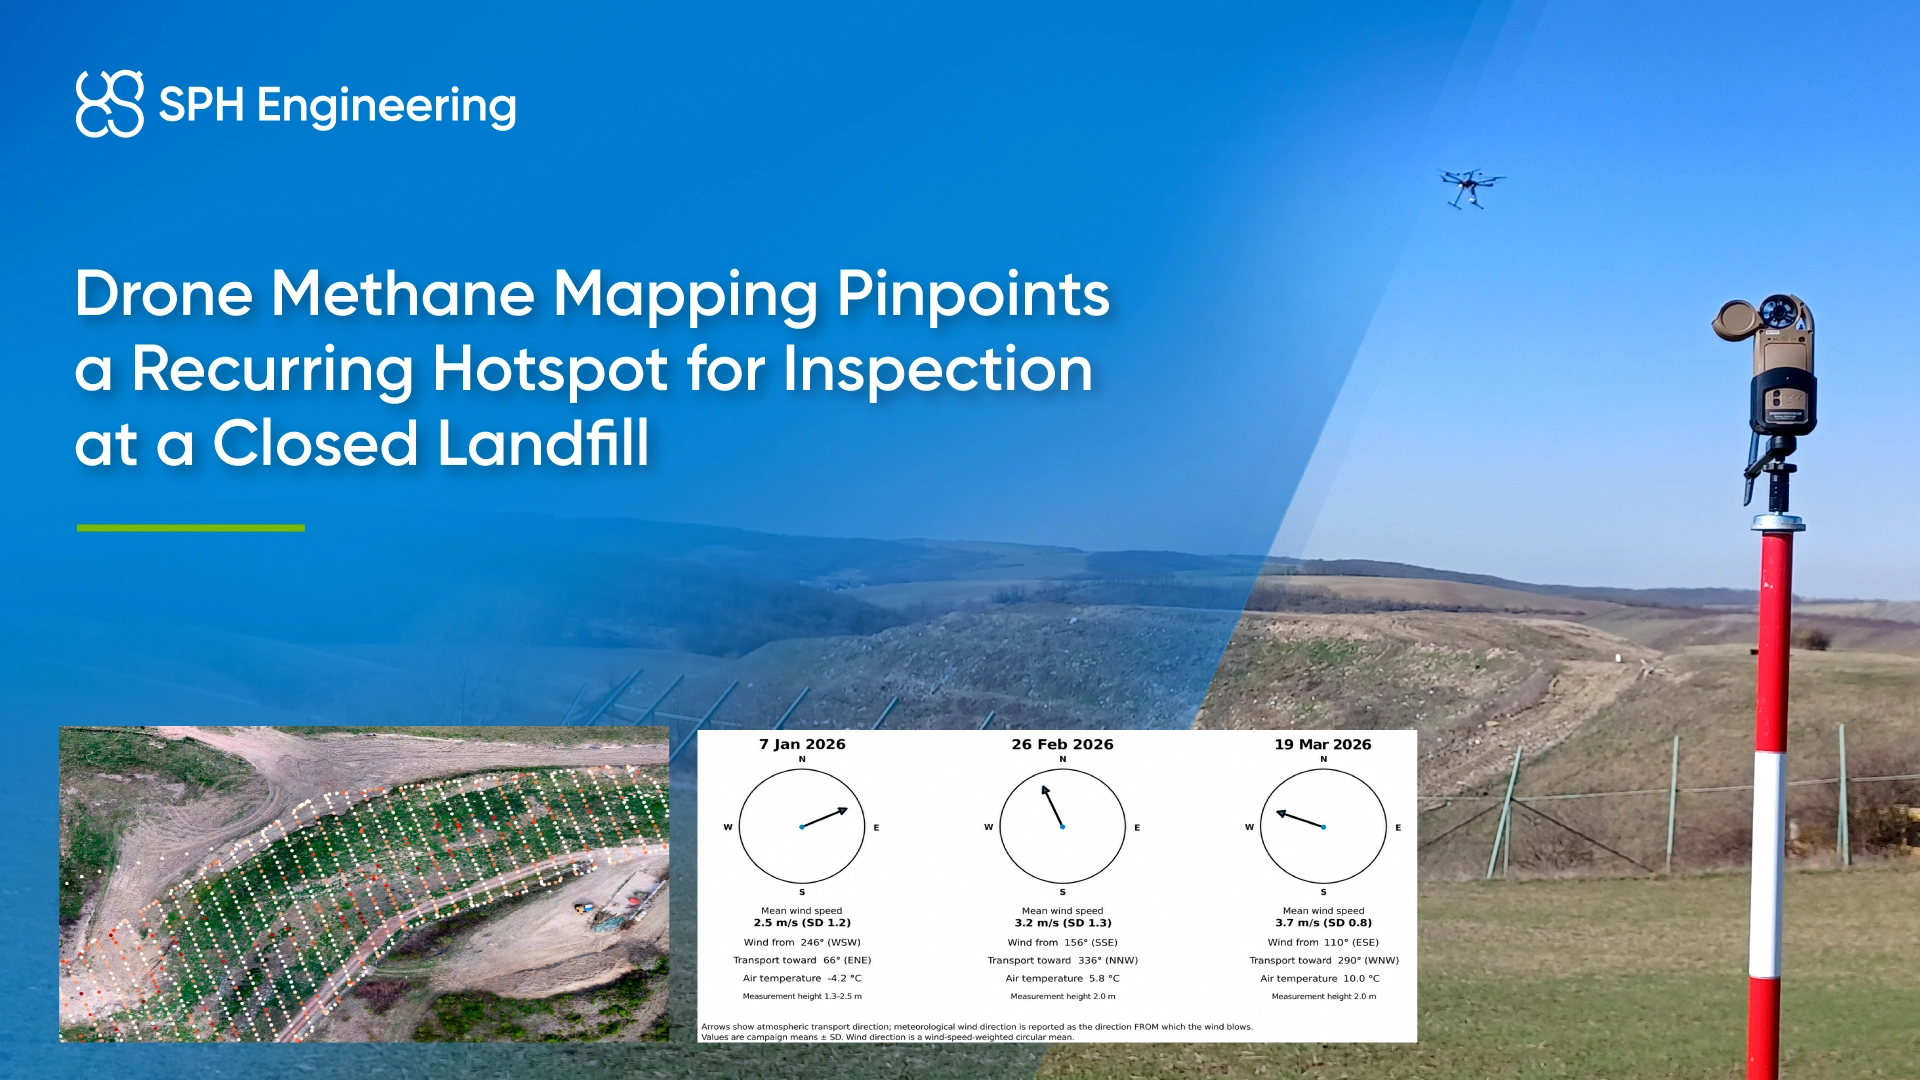
The results guided a field inspection, which identified a possible leaking landfill gas (LFG) collection component at the hotspot. This gave the team a specific location for further technical investigation during reclamation.
Quick Facts
- Organization: CzechGlobe, Global Change Research Institute of the Czech Academy of Sciences
- Location: Czechia
- Application: Methane hotspot detection during landfill closure and reclamation
- Campaigns compared: January 7, February 26 and March 19, 2026
- Methane sensor: Laser Falcon 2, based on tunable diode laser absorption spectroscopy (TDLAS)
- Flight planning and integration: SPH Engineering’s UgCS and SkyHub
- Spatial analysis: QGIS, with inverse distance weighting interpolation
- Supporting tools: SPH Engineering’s DroneGIS, Agisoft Metashape and ENVI
- Measurement: Path-integrated methane concentration, expressed in ppm·m
- Key result: A recurring hotspot that guided the inspection of a possible leaking gas collection system component
Methane Screening During Landfill Closure
The landfill had stopped accepting waste and was entering reclamation. Methane could still escape through the cover or components of the gas collection system, while atmospheric conditions could alter the location of elevated readings.
The landfill operator needed to screen the landfill systematically and determine whether hotspots reappeared at the same locations. Ground inspections provided local observations, but repeated aerial coverage added spatial context across the surveyed surface. The objective was to identify locations for closer inspection and establish a repeatable method for comparison over time.
Repeatable Drone Methane Surveys with UgCS, SkyHub, and Laser Falcon
Researchers prepared missions in UgCS flight planning software with repeatable flight geometry so that successive campaigns could be compared spatially. The SkyHub onboard computer integrated the Laser Falcon 2 TDLAS methane detector with the UAV and associated methane measurements with aircraft position.
During each flight, the detector recorded path-integrated methane concentration in ppm·m. These readings represented methane along the laser measurement path; they did not measure an emission rate.
The team also recorded wind speed, wind direction and air temperature independently in the field. These observations helped researchers interpret whether differences between methane maps could reflect atmospheric transport.

Methane Hotspot Mapping and Comparison Between Surveys
After each campaign, researchers processed the georeferenced methane observations and mapped their distribution across the landfill. They used inverse distance weighting (IDW) interpolation in QGIS to estimate values between measurement locations.
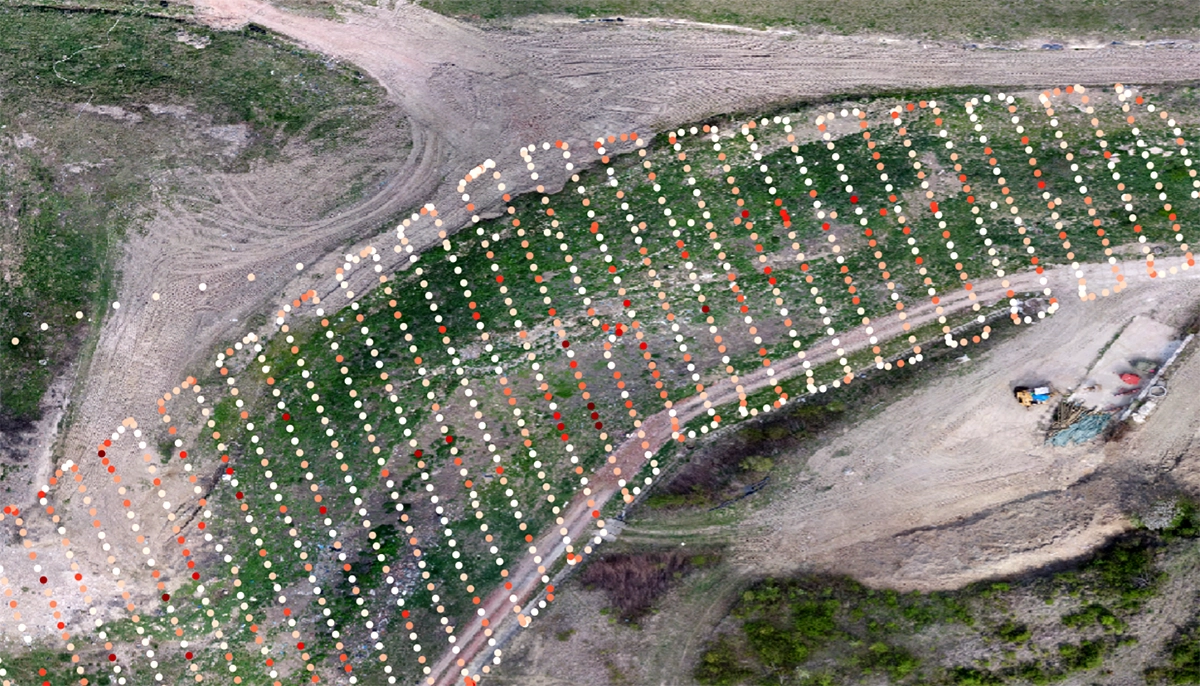
The spatial dataset also included an orthophoto, digital terrain and surface models (DTM and DSM), and airborne LiDAR data. These provided context for the methane observations and site features.
The comparison followed four steps:
- Map elevated methane readings from each campaign.
- Compare their locations across the three survey dates.
- Review wind conditions for possible plume displacement.
- Prioritize recurring hotspots for field inspection.
The interpolated maps showed estimated patterns between sampled locations. They supported screening and follow-up. Field checks were still needed to confirm the source of each elevated reading.
Comparing Methane Detections Under Different Wind Conditions
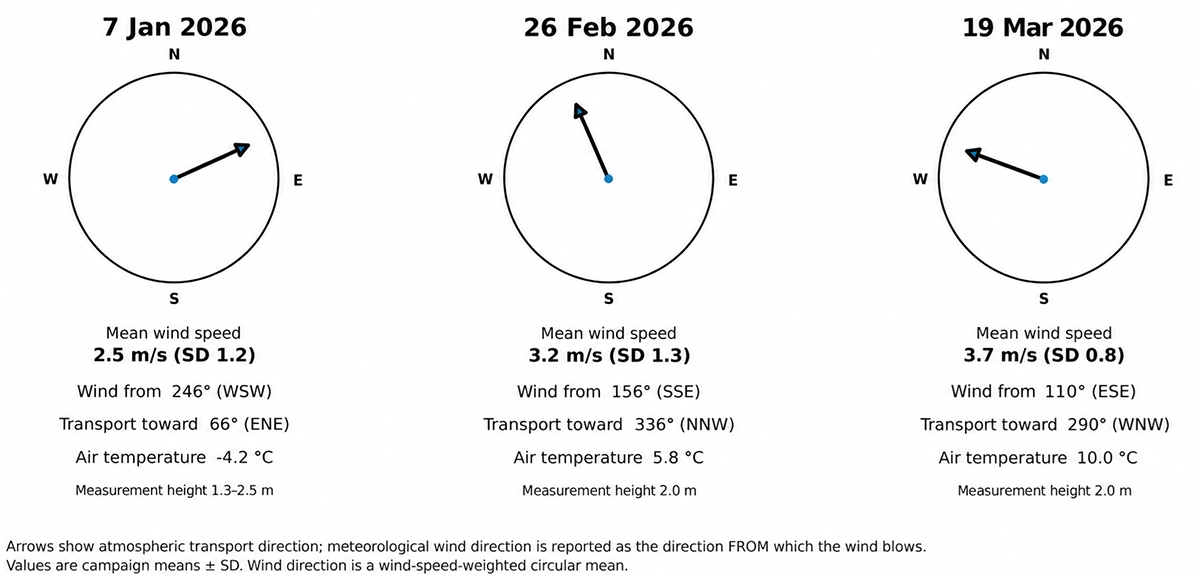
The three campaigns covered substantially different weather conditions. Mean wind speed ranged from 2.5 to 3.7 m/s, while mean air temperature ranged from −4.2 to 10.0 °C. Wind came from the west-southwest in January, south-southeast in February and east-southeast in March. The team considered these changes when comparing hotspot positions.
Repeated detection at the same location under different winds strengthened the interpretation of a recurring local source. It provided more evidence for targeted inspection than a single survey could offer.
A Recurring Methane Hotspot Guided Field Inspection
The methane maps showed localized potentially anomalous concentrations of methane across the surveyed area. One hotspot reappeared at the same location in all three campaigns. Researchers inspected that location and identified a feature that could belong to the landfill gas collection system. Its position provided a plausible explanation for the recurring methane readings, but further technical investigation was needed to establish whether it was the source. The result narrowed a landfill-scale screening task to a specific inspection point.