
Project type: Drone-based 3D crop phenotyping for plant breeding research
Challenge: Capture the same crop plots from the air, week after week, with enough consistency to track how individual seed heads change over a full growing season.
Solution: UgCS planned and exported repeatable circular and grid flight missions at 5 m flight altitude, flown in weekly campaigns over 8 weeks with a DJI Mavic 3 Enterprise.
Results:
- 8-week UAV campaign with repeat missions planned by treatment-replication block
- Each plot was captured with two fast video-based flight patterns: about 20 seconds for the circular pass and about 30 seconds for the grid pass
- 0.85 mAP panicle detection on real crop data (vs 0.68 for the VoteNet baseline in the study’s ablation test)
- Panicle height measured at r = 0.984 against lab-based 3D reference models
Team: University of Queensland (Schools of Agriculture & Food Sustainability and Electrical Engineering & Computer Science)
Publication: Plant Phenomics 7 (2025) 100050
Why Manual Sorghum Panicle Measurement Does Not Scale
Traditionally, this means people walking the field with rulers and clipboards, measuring plants by hand. Manual sorghum panicle measurement is slow, tiring, and does not scale. A single trial can hold hundreds of plots and thousands of plants, and the panicles keep changing every week as the crop grows. Measuring everything by hand, repeatedly, across a whole season is close to impossible.
A team at the University of Queensland set out to do it from the air instead. The plan: fly a drone over the trial, build a detailed 3D model of every plot from the video, and let a computer detect and measure each panicle automatically.
That plan only works if one thing holds true. To track how a plant changes over time, you have to capture it the same way every single time. If this week’s flight is a little higher, a little faster, or follows a slightly different path than last week’s, the 3D models will not line up, and any change you measure could just be a change in how you flew, not a real change in the plant.
So the whole project rested on a practical question: could they fly the exact same missions, over the exact same plots, week after week, for two months straight?
The Solution: Repeatable UAV Flight Planning in UgCS
The team used UgCS to design and export the flight paths for the whole campaign. They built the missions once, grouped by treatment-replication block, and flew them on a DJI Mavic 3 Enterprise. Because the missions were saved in UgCS, the same flights could be loaded and flown again in each weekly campaign with no guesswork and no redrawing.
Circlegrammetry in UgCS is a tool that enables drones to scan areas by flying in circular patterns. This technique allows the drone to capture ground objects from multiple angles, significantly increasing the level of detail in the resulting 3D model compared to conventional survey methods.
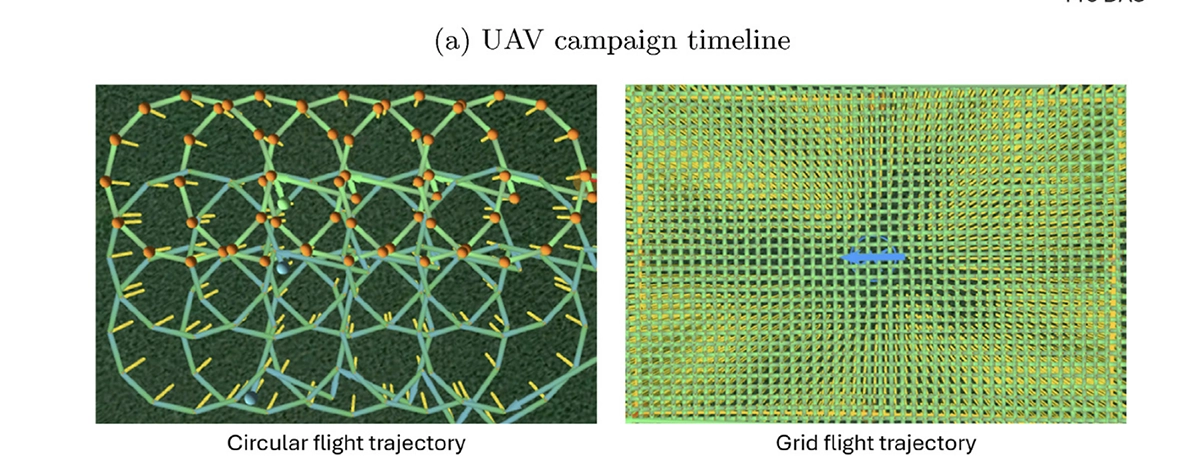
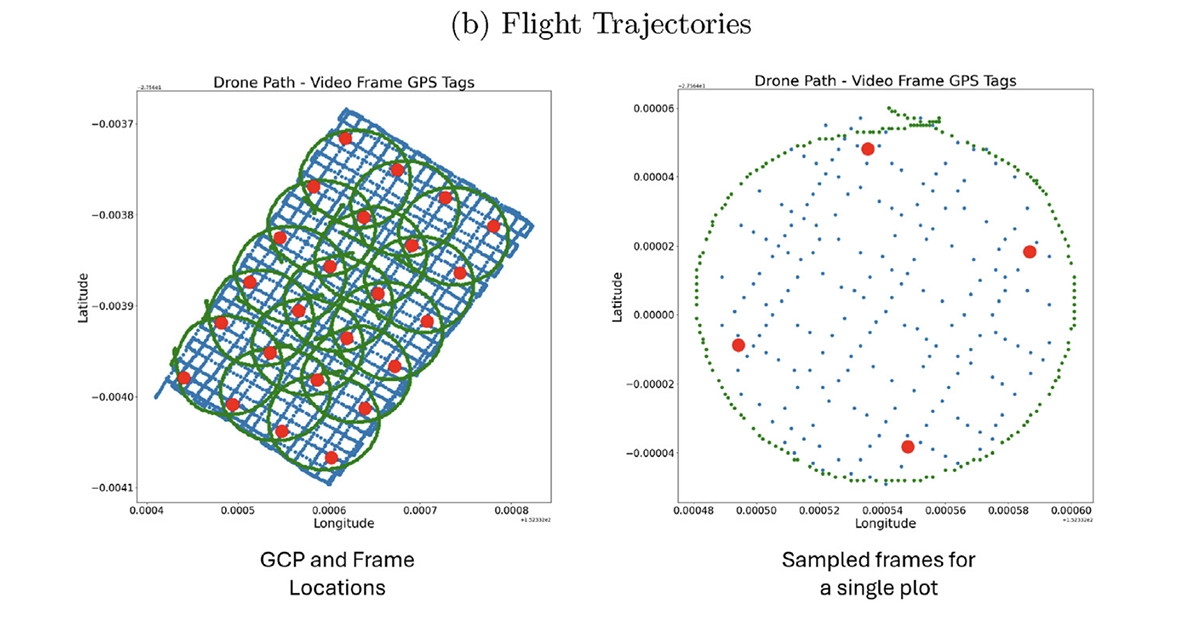
For each plot they used two complementary flight patterns, both planned in UgCS:
- Circlegrammetry that orbits the plot at a 6 m radius with the camera angled down at 45 degrees. This captures the plot center from many angles, which is what a 3D model needs to look right.
- A double-grid photogrammetry that runs back and forth across the plot in a cross-hatch pattern. This fills in even coverage across the whole plot, so no area is undersampled.
Both were flown at approximately 5 m above the ground. Instead of stopping to take still photos, the drone recorded video while moving at 2.5 to 4.5 m/s. The circular pass covered a plot in about 20 seconds and the grid pass in about 30 seconds. Older methods that stop for each photo can take five minutes per plot. Recording video on a planned UgCS path cut each pass to well under a minute, which is what made flying the entire trial in weekly campaigns realistic.
What clean flight planning made possible
Everything downstream depended on clean, consistent flights:
- Consistent low-altitude passes. Holding 5 m and a steady speed kept image quality high enough to build sharp 3D models where individual seed heads could be told apart, even in dense, crowded canopies.
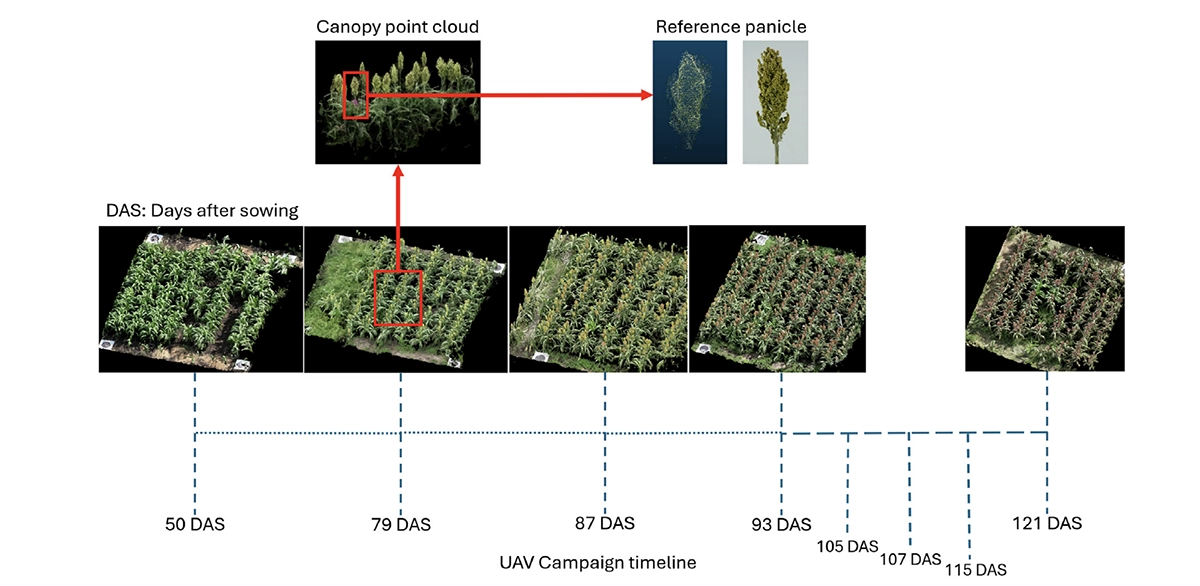
- Repeatability across the season. The team conducted weekly UAV campaigns over 8 weeks, alternating between treatment blocks, from when the seed heads first emerged through to crop maturity. Reusing the saved missions meant the team could compare like with like and trust that any change they saw was the plant growing, not the flying changing.
- Two flight types, one plan. Circular orbits and grid passes were planned and exported from the same software. No juggling separate tools for separate patterns.
After flying, the video frames went into a photogrammetry and 3D reconstruction pipeline, and a purpose-built deep learning detection model (which the team named SegVoteNet) found and measured each panicle in the resulting point cloud. UgCS sat at the front of that chain: using its Circlegrammetry and Photogrammetry tools, along with the ability to plan low altitude flights, it allowed the researchers to get clean, repeatable data off the field and into the workflow.
The Results: 0.85 mAP Panicle Detection Across an 8-Week Campaign
The repeatable flights gave the team the consistent data their detection model needed. The headline numbers:
- 0.85 mAP panicle detection on real crop data. That is a strong score for spotting individual seed heads in a crowded field. The team’s SegVoteNet model reached 0.850 mAP@0.5 IOU on the real test set, compared with 0.679 for the VoteNet baseline in the study’s ablation test.
- Panicle height matched lab-based 3D reference reconstructions at r = 0.984. The heights measured from the drone-built 3D models were almost identical to those from high-quality 3D reference models of the same panicles reconstructed in the lab. Length and width also tracked closely, at r = 0.938 and r = 0.894.
- Each plot was captured in two fast passes. About 20 seconds for the circular flight and about 30 seconds for the grid flight. Fast enough to fly an entire trial in a session, and to repeat it across weekly campaigns.
- A full 8-week season of consistent data. The crop was flown in weekly campaigns from seed-head emergence to maturity, producing a time series clean enough to compare different sorghum varieties against each other.
As a real example from the study, the team compared two varieties, Mr-Buster and Sentinel-IG. Both had similar panicle height distributions, but the drone data clearly showed Mr-Buster had more than double the panicle radius of Sentinel-IG, with fewer panicles overall. That is exactly the kind of difference a breeder wants to see, and it came out of data that started with a repeatable UgCS flight.
What Survey and Mapping Operators Can Take From This
This project shows how much flight consistency drives the science. The science was about counting and measuring seed heads, but none of it would have worked if the flights drifted from week to week.
Source:
This case study is based on “A scalable and efficient UAV-based pipeline and deep learning framework for phenotyping sorghum panicle morphology from point clouds,” by Chrisbin James, Shekhar S. Chandra, and Scott C. Chapman (University of Queensland), published open access in Plant Phenomics, volume 7 (2025), article 100050. Published under a Creative Commons Attribution (CC BY) license.