

What underground utility mapping has to produce
The deliverable for an underground utility map is a set of locations, depths and confidence levels for buried infrastructure that other people can act on. The American Society of Civil Engineers defines four quality levels of confidence in its ASCE 38-22 standard, ranging from Quality Level D (existing records only) up to Quality Level A (a utility physically exposed by vacuum excavation and surveyed in place). Quality Level B sits in the middle and is where most geophysical work lives; it uses surface geophysical methods like GPR and EM locators, to designate a utility's horizontal position without breaking ground.
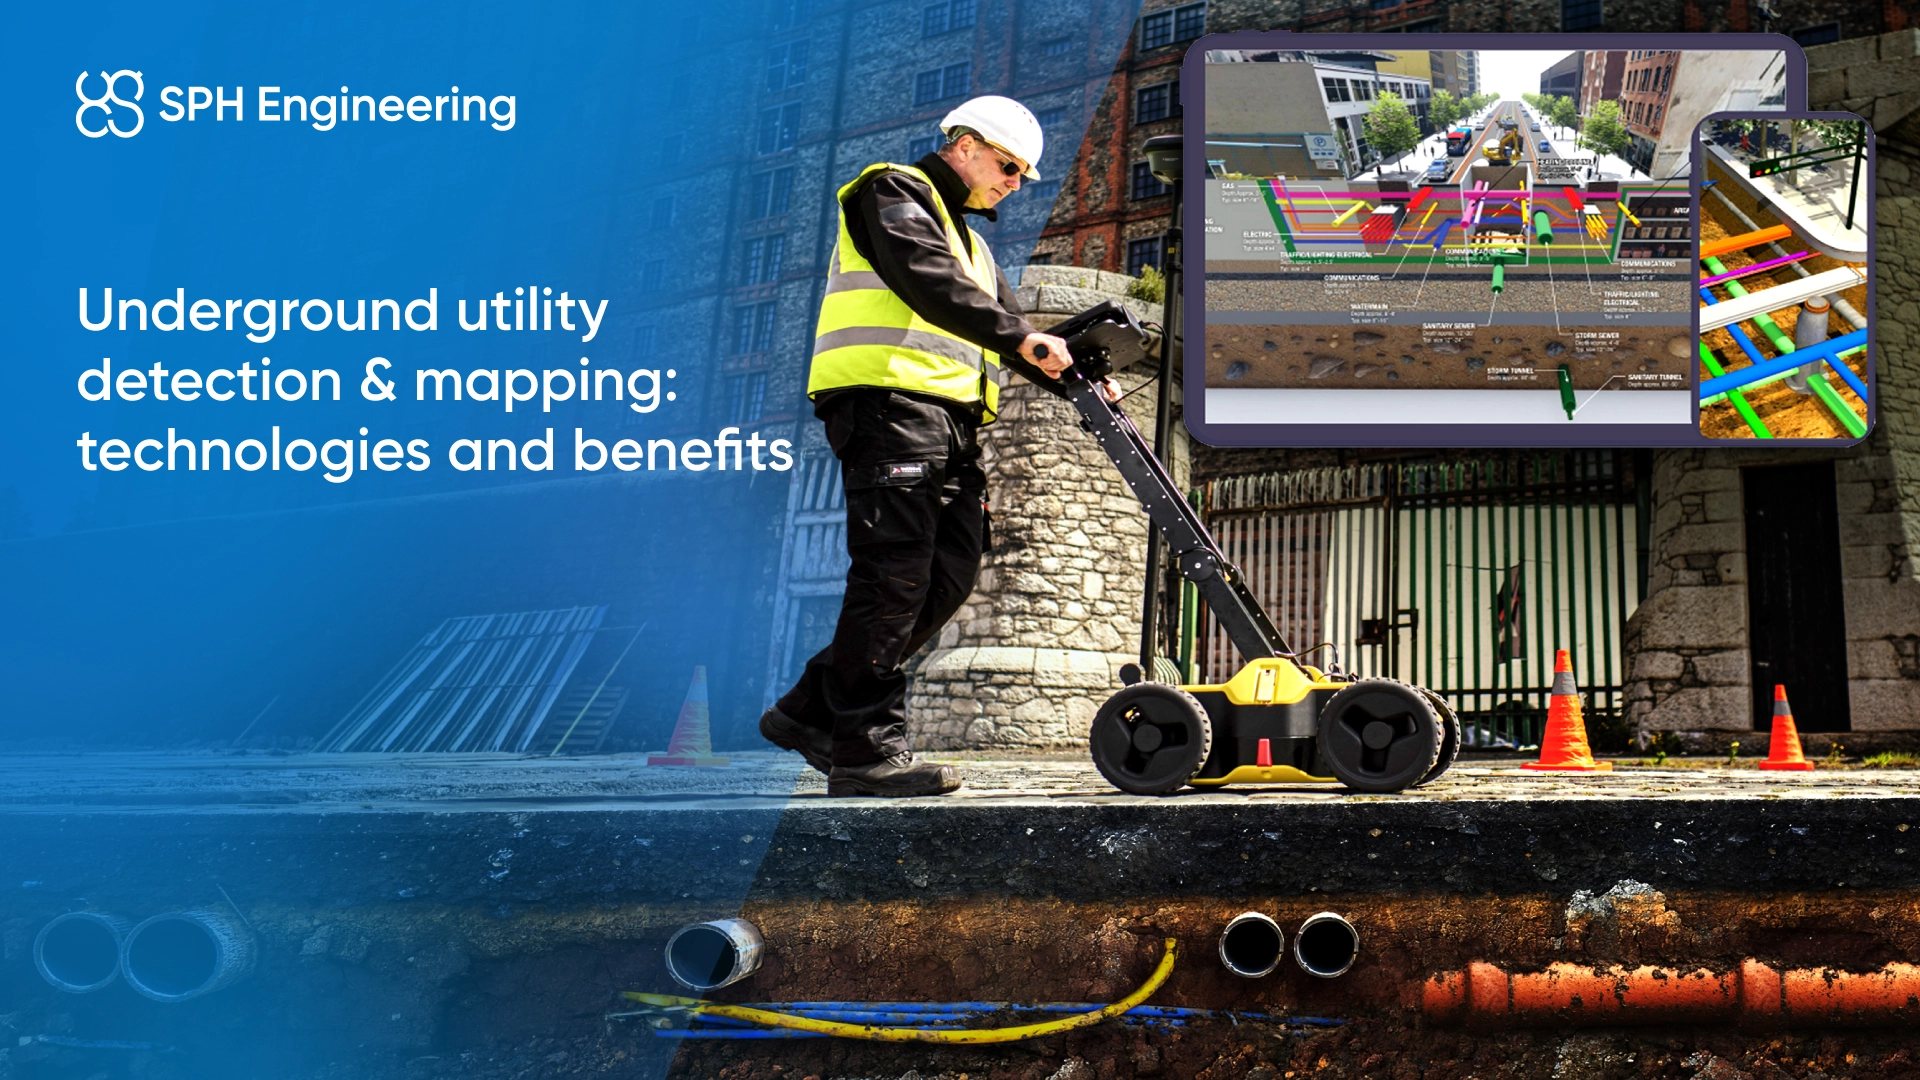
The infrastructure covered by that brief is more varied than most project owners realize. A typical urban site can carry water mains and service connections, sanitary and storm sewers, natural gas distribution (steel for medium pressure, polyethylene for residential), buried electric in conduit or direct-buried, copper telecom, fiber-optic lines in microducts, and in colder markets district heating mains. Older neighborhoods add layers no one documented well: abandoned services, decommissioned fuel-oil tanks, pre-war clay drainage, and private lines on the customer side of the meter that were never recorded centrally. Each material responds to detection methods differently, which is why no single underground mapping tool sees everything.
Most projects need a mix of these levels. A pipeline corridor across farmland might get QL-B mapping over the whole route with QL-A potholing at tie-in points. A downtown rebuild needs QL-A confirmation at every critical conflict. A remote industrial or brownfield site might be fine with QL-C reconciliation and a few QL-B sweeps for old services or workings. Confusing these levels is where utility mapping projects start losing money. People specify QL-A when QL-B will do, or assume QL-B will deliver QL-A precision and end up severing a fiber line.
The main technologies for mapping the underground
Each of the underground mapping tools below detects something different. No single method sees everything. The art of subsurface utility mapping is choosing the right combination for a given site.
Existing records and surface markers
The cheapest information is what you already have. Utility owners, one-call services such as 811 in the US, and city archives all hold records of buried infrastructure. Surface markers such as manholes, valve boxes, hydrants, and pedestals back those records up where they exist.
The trouble is reliability. Records age, projects get built without as-built drawings, ownership changes, and abandoned utilities rarely get marked at all. In any urban area built up over decades, records are often substantially incomplete and/or out of date. They are still the right starting point, just not the finishing point.
In the US, One Call (811) services sit on top of these records. A contractor calls in a dig ticket, utility owners send locators to mark the approximate location of their assets in the field, and that paint-and-flag pattern usually becomes the legal minimum before excavation. It works for typical residential and commercial work. It is also incomplete in ways the call-centre script does not mention: One Call only marks active, owner-claimed utilities.
Abandoned lines, private lines on the customer side of the meter, non-member facilities, and any utilities whose owners do not respond to the ticket may not appear in the marks. Surveyed One Call paint marks are not equivalent to ASCE 38 Quality Level B either, even when a surveyor records the position. Typical industry-standard burial depths (water mains commonly between 1.0 and 1.5 m, gas distribution between 0.6 and 1.0 m, telecom between 0.3 and 0.6 m) are useful only as a rough planning baseline. Real-world depths drift over decades as roads are repaved, grades changed, and new services are tied in above old ones.
Electromagnetic (EM) locators
EM locators apply or detect an electromagnetic signal associated with a conductive line and trace it with a receiver above ground. They are the bread and butter of utility location whenever the buried asset is metallic or has a tracer wire, is sufficiently continuous, and can be accessed or reached at one end. Connect a transmitter to an accessible valve, hydrant or a service entry, and thereceiver traces the signal path.
What they do not do themselves: locate non-conductive utilities such as PVC water lines, plastic gas mains, or unreinforced concrete laterals without a tracer wire, sonde, or other signal source. They also struggle when several parallel utilities run together or share bonds and grounds, because the signal can couple onto neighbouring conductors.
Ground penetrating radar (GPR)
GPR transmits short electromagnetic pulses into the ground and records reflections from contrasts in dielectric permittivity and conductivity. It can imagine both metallic and non-metallic utilities when there is enough contrast between the target and the surrounding medium, which is why it is the workhorse of subsurface utility mapping for anything beyond simple metal-pipe tracing.
Antenna frequency is the trade-off that matters. Higher-frequency systems, (around 1 GHz) deliver fine resolution for shallow targets, typically up to about half a meter from a drone or close to a meter from a cart in average soil. Lower frequencies (300 MHz down to 50 MHz) can reach several meters or more in favorable conditions, but they will not detect thin pipes, only larger features. For most buried utility detection in the 1 to 2 meter range, a 500 or 600 MHz system usually is the right call. The full depth-resolution table by antenna and the practical limits for each frequency are on our GPR technology page, and the GPR calculator lets you check expected detection for a target size, depth, and soil type before committing to a system.
GPR struggles in clay, saline soils, and ground saturated by recent rain. These materials attenuate the signal before it can return, and no amount of post-processing recovers what was not recorded.
Magnetometers
Magnetometers measure the Earth's magnetic field and detect anomalies caused by ferrous (iron-containing) objects. For underground utility mapping, that means steel pipelines, well casings, manhole covers, abandoned tanks, and reinforced concrete pipes with ferrous reinforcement.
A magnetometer generally will not detect copper cables, aluminum, plastic, or non-magnetic stainless steel. That is a hard physical limit. Where the target is large and ferrous, magnetometers can detect features that GPR would miss, especially in high-conductivity soils. Abandoned wells, steel tanks, and large pipelines several meters below the surface may produce clear magnetic anomalies. The full breakdown of drone-based magnetometer systems and their applications is on our magnetometer solutions page.
Acoustic and vacuum methods
Acoustic leak detectors correlate the noise produced by pressurized water leaks or trace gas through pipes. They are leak-detection tools more than general mapping tools, but they earn their place when GPR and EM both fail.
Vacuum excavation (also called soft-dig or hydro-excavation) is the only method that delivers QL-A confidence. It physically exposes the utility through a small hole using compressed air or water. Slow and expensive, but unbeatable when you need to know exactly what is there before driving piles or installing microtunneling.
Cart, handheld, or drone? Choosing the right underground mapping tool
Most underground utility mapping work still happens with a cart-based GPR unit pushed over a paved surface, and that is correct. Drone-based subsurface mapping is sometimes oversold. A UAV is not a replacement for a cart on a downtown street, and SPH Engineering will tell you that directly. Drone-mounted GPR is not suited to confined urban spaces, and its effective penetration and resolution can be lower than the same antenna used close to or in contact with the ground because the air gap changes coupling, reflection, and noise conditions. Where airborne underground utility surveys do change the math is on sites a cart cannot practically cover, or where the ground itself is dangerous to walk on.
Where drone-based underground utility surveys earn their keep
A drone-based underground utility survey can be the right answer in roughly four scenarios.
1. Long pipeline and corridor surveys
Mapping 30 km of pipeline right-of-way with a cart can take weeks. A drone with GPR and a magnetometer running parallel survey lines can cover the same route much faster, with consistent line spacing and georeferencing tied to RTK GNSS. SPH Engineering's True Terrain Following system uses the SkyHub onboard computer to hold the antenna at a constant low height above uneven ground. Stable antenna height is one of the parameters that matters most for radar data quality.
2. Hazardous or contaminated ground
Old industrial sites, brownfields, mine tailings ponds, and former military training areas all carry risks that get worse the longer a person walks across them. A drone keeps the operator at a safe standoff while the sensors collect data.
3. Difficult terrain
Wetlands, glaciers, debris-covered slopes, freshly excavated stockpiles, and any site where the ground cannot bear a wheeled cart are better candidates for airborne surveys. Our recent project case study on airborne GPR for ice and snow studies covers the workflow on terrain that no cart can reach.
4. Verification across large rural footprints
Solar farms, wind farms, and pipeline crossings often sit on land where the records are weak, and the area is too large to walk. Drone-based subsurface mapping gives a first-pass overview that focuses ground crews on the spots that actually need attention.
A working example is in our airborne GPR water pipe detection case study, which documents a Zond Aero 500 system mapping water mains across a survey corridor. The case study reports that the GPR profile resolved the pipeline against the surrounding subsurface under those site conditions. That is a useful template for what to expect from drone-based GPR on the right kind of site, but not a guarantee for every soil target.
Where airborne GPR is the wrong tool
A few situations make drone-based subsurface mapping a poor fit.
1. Urban streets and confined spaces
Buildings, traffic, regulations on flying over people, and the requirement to keep the antenna very close to the surface all argue for a cart. SPH Engineering supplies cart configurations of the same Zond Aero GPR systems for exactly this reason, and positions drone use mainly for large open areas without tall obstacles or vegetation.
2. Tall vegetation and forest canopy
Drone GPR is not suited to dense vegetation or forest canopy. The radar pulse needs to enter the soil, and vegetation biomass, moisture, and increased antenna-to-ground distance can scatter or attenuate the signal. In these conditions, terrestrial methods on a cleared survey grid are usually the only realistic option.
3. Saturated soils and clay
Even the best drone GPR setup loses most of its useful depth in clay-rich or recently saturated ground. Schedule airborne underground utility surveys during dry periods, and check soil conductivity before committing.
4. Saltwater
Electromagnetic energy does not propagate through saline water, as it is highly conductive and the signal gets attenuated, so GPR is a non-starter in marine environments and brackish wetlands.
If a project hits any of these conditions, the right move is to recommend a different method rather than push drone GPR into a job it cannot do well. An aerial-only approach to utility mapping does not reflect what the technology actually does in the field.
Combining GPR and magnetometers for higher-confidence underground utility maps
For higher-stakes underground utility surveys such as pipeline integrity audits, abandoned-well searches, or brownfield redevelopments, a single sensor is rarely enough. GPR sees boundaries between materials with different dielectric properties. A magnetometer detects ferrous mass. EM locators trace continuous conductors when you can inject or detect a signal on them.
Run two of those over the same survey lines, and you cross-validate every find. A GPR hyperbola at 1.2 m that lines up with a clear magnetic anomaly at the same coordinates is strong evidence for a ferrous utility, such as a steel pipe. A GPR hyperbola without a matching magnetic signature may indicate a non-ferrous or non-magnetic utility, such as a plastic gas pipe, fiber duct, or a concrete sewer, but it still warrants follow-up with a tracer-wire EM locating a sonde, or a vacuum pothole.
SPH Engineering's GeoHammer can handle multi-sensor processing on a unified timeline, which makes the cross-correlation work more practical than of an export-import workflow across three different vendor formats.
Mapping the underground in 3D for trenchless drilling
Horizontal directional drilling (HDD) crews need more than a horizontal track showing where each utility runs. They need a vertical profile that shows how deep each line is at the point where the bore will cross it. A 2D underground utility map plotted in plan view leaves the driller guessing.
Building a 3D utility model means combining several inputs that rarely agree with each other: geophysical readings, electronic depth measurements (e-depths) from EM locators, invert elevations from valves and chambers, as-built drawings where they exist, and typical burial depths as a fallback. Every one of these has its own error budget. Electronic depths may reference the centreline of a metal pipe, but from the top of a tracer wire on a plastic line. Sondes run inside an empty pipe may report invert depth, not crown depth.
Older as-built drawings often reference a different surface elevation than the current ground surface, so the depths printed on them need to be re-tied to the project's working datum before they can sit alongside fresh field data.
Drone-based GPR contributes to this kind of model best when survey lines are tightly spaced, and georeferencing is RTK-accurate. Cross-sections through the GPR data provide a depth-to-target estimate that can be reconciled against EM e-depths and any potholing data. Where the three sources agree within a tolerance, depth can be treated as higher confidence.
Where they disagree, the conservative case wins, and a pothole is scheduled before drilling. That is the part trenchless contractors learn the hard way: a 3D utility model is a planning tool and a risk register. It does not replace daylighting the line at every critical conflict before the drill bit goes into the ground.
What proper underground utility mapping delivers
The benefits of underground utility mapping are usually framed in vague terms, such as safer projects, fewer delays, and better collaboration. A complete underground utility map shifts a project's risk profile in four concrete ways.
- Cost reduction: A single backhoe strike through a fiber bundle can run into the tens of thousands in repair charges, and business interruption claims often dwarf the repair cost. A struck high-pressure gas main can be fatal.
- Reduces rework: Designs that conflict with utilities found during construction trigger redesigns, change orders, and the cost of idle crews while engineers rework drawings. Catching the conflict in design, when relocating a pipe is still a line on a drawing, is often far cheaper than catching it in the field.
- Defensible documentation: ASCE 38-based utility mapping deliverables go on record with the design and survive into operation and maintenance. They are the documents a future contractor or owner can rely on, and they help define the upstream party's due diligence. When a utility is hit during construction, the question of who pays for the damage and the lost production time turns partly on the quality of the survey data behind the design. A QL-B underground utility map signed by a qualified professional sits in a very different place in that conversation than a screenshot of an 811 paint job.
- Permissions for regulated projects: Pipeline crossings, road authority permits, and environmental approvals may increasingly require evidence of subsurface investigation. A clear underground utility map can shorten the back-and-forth.
The fourth point is underrated. A surprising amount of project schedule slip on infrastructure work can come from regulators bouncing submittals back for missing subsurface data, not only from construction problems.
How to build a defensible underground utility map
Three practices separate utility mapping deliverables that hold up under review from the ones that get torn apart in claims.
1. Match the technology to the site, not to the budget
An urban rebuild needs cart-based GPR, EM locators, and vacuum potholes. A 20 km pipeline route may need drone-based GPR plus a magnetometer, with QL-A spot checks at tie-ins and critical crossings. Forcing the wrong tool into the wrong context is what produces the maps that fail under scrutiny.
2. Cross-validate
No single sensor is reliable in every condition. Records plus EM, or GPR plus magnetometer, or any equivalent pairing will catch what one tool would miss. The cost of a second sensor is small next to the cost of a missed utility.
3. Document the limitations
Every underground utility map should record what was surveyed, what equipment was used, what conditions were present, and what zones the survey could not assess. A defensible map says where the gaps are. A bad one pretends there are not any. The same caution applies to utility maps generated from online records or pulled together by AI tools from public sources. The map is only as good as its inputs, and without geophysical verification or potholing, it should be treated as a planning sketch and nothing more.
For project teams considering whether drone-based methods belong in their underground mapping workflow, the right starting point is a candid conversation about the site. SPH Engineering's team can review survey area, terrain, soil conditions, and target depths, and then recommend a system anywhere from cart-based GPR to a fully airborne multi-sensor configuration. Most projects benefit from a combination, not one or the other.
Discuss your underground mapping project with SPH Engineering