


However, executing a successful LiDAR mission requires more than just buying a sensor. It demands a deep understanding of hardware physics, precise flight planning, and rigorous data processing. This comprehensive guide explores the LiDAR ecosystem, compares mechanical vs. solid-state sensors, and details the specific workflows needed to capture survey-grade data.
Key Takeaways:
- Penetration Power: Unlike photogrammetry, UAV LiDAR penetrates dense vegetation to map bare earth, making it essential for forestry and overgrown terrain.
- Operational Independence: Active laser illumination allows for mapping in low light, shadows, or even complete darkness, decoupling operations from the sun.
- Sensor Physics: Understanding the difference between Solid-State (e.g., Zenmuse L2) and Mechanical (e.g., Riegl) sensors is critical for matching hardware to project accuracy requirements.
- Flight Planning is Vital: Success depends on True Terrain Following to maintain constant point density and specific IMU Calibration maneuvers (Figure-8s) to prevent data drift.
- High-Value Verticals: LiDAR unlocks premium billing rates in specialized industries like powerline inspection, mining volumetrics, and archaeological discovery.
What Is a LiDAR Drone and Why Should You Care?
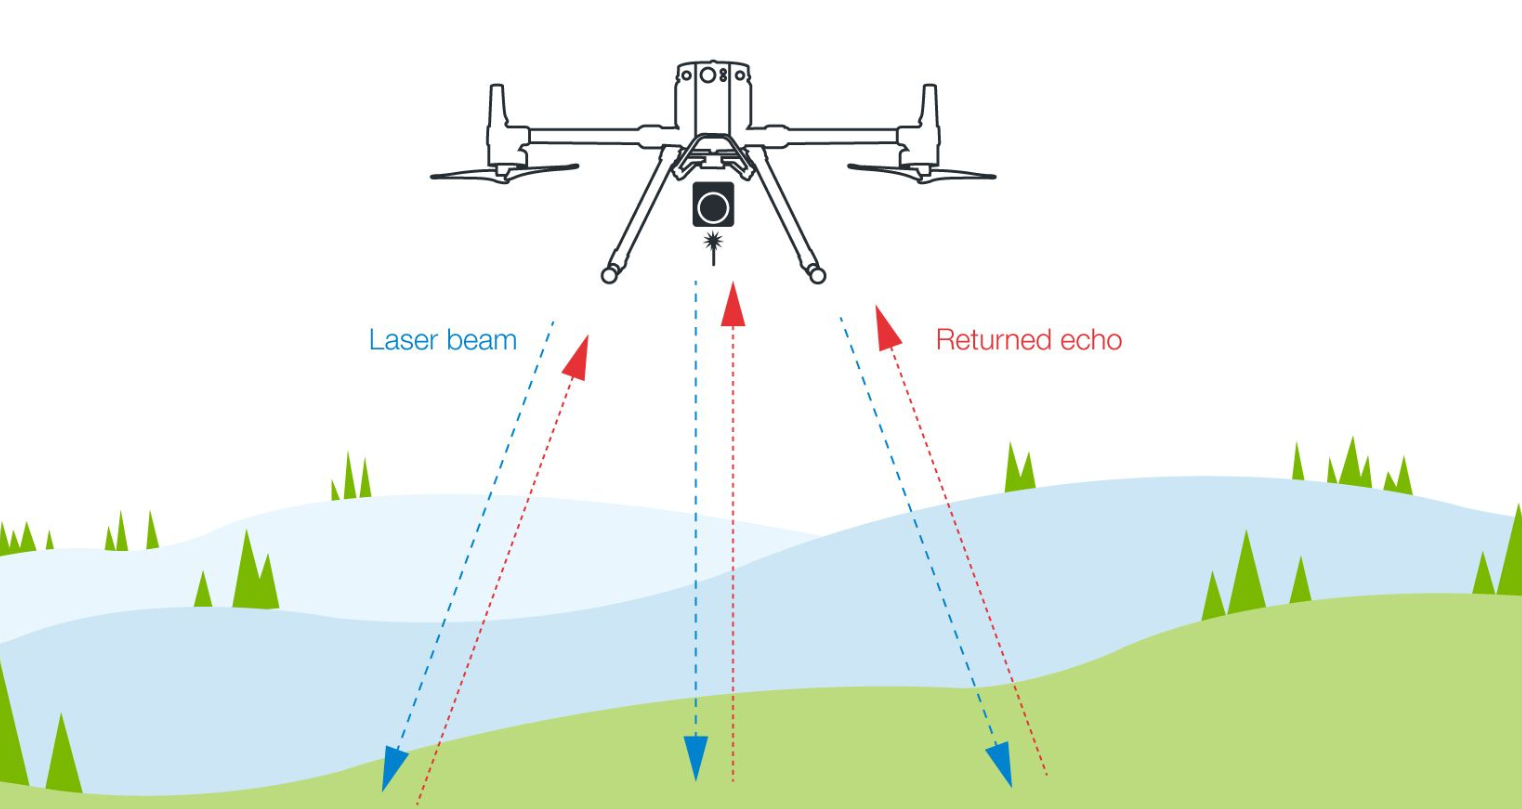
LiDAR (Light Detection and Ranging) is an active remote sensing method. A drone LiDAR sensor emits thousands of laser pulses per second, often between 100,000 and 1.5 million, at the ground. The system measures the precise time it takes for each pulse to bounce back, calculating the exact distance to the surface.
The result is a Point Cloud: millions of georeferenced 3D coordinates (XYZ) that represent the physical world with millimeter-level precision. Unlike photogrammetry, which relies on ambient light and visual texture, LiDAR provides its own illumination, allowing you to map in low light, under heavy vegetation, or over featureless terrain like snow.
LiDAR vs. Photogrammetry: Which Tool for Which Job?
LiDAR and photogrammetry solve different problems. While photogrammetry excels at creating visually realistic 3D models of buildings, LiDAR is the superior tool for determining ground elevation in complex environments.
Photogrammetry excels at texture capture and 3D modeling of buildings or structures. You get true-color orthophotos and visually rich models. LiDAR produces bare geometric data (XYZ coordinates with intensity values). For vegetation analysis, terrain modeling under canopy, or surveys in poor lighting, LiDAR wins.
Cost also drives the decision. If you already own a drone with a high-resolution camera, photogrammetry adds minimal expense. LiDAR requires a $20,000-$60,000 payload investment. But clients pay premium rates for LiDAR data quality. A single powerline corridor contract can cover payload costs.
Processing workflows differ too. Photogrammetry software like Pix4D or Agisoft Metashape generates point clouds from overlapping images. LiDAR produces raw point clouds directly. You classify ground points, filter noise, and extract features using software like TerraSolid, LAStools, or CloudCompare. Processing is faster because you skip the image-matching step.
Some operators run both sensors simultaneously. DJI's L1 and L2 payloads include RGB cameras. You capture LiDAR point clouds and photos in one flight. This combines the penetration and accuracy of LiDAR with the visual context of photogrammetry. Clients get deliverables that meet multiple needs from a single survey.
To further explore the differences between LiDAR and photogrammetry, read our post where we compare these technologies when used for volumetric measurements.
Why Professional Pilots Choose LiDAR for Mapping
Penetrates vegetation. Dense forest canopies block camera views. LiDAR pulses slip through gaps in foliage and hit the ground. You get bare-earth elevation models without leaf interference. Forestry managers use this for timber volume estimates. Environmental consultants map flood zones under tree cover.
Works in low light. Photogrammetry needs good lighting for texture and shadows. LiDAR supplies its own illumination. Fly during cloudy weather or in early morning without quality loss.
Delivers vertical accuracy. Photogrammetry excels at horizontal positioning but struggles with Z-axis precision on flat, textureless surfaces like asphalt or water. LiDAR hits ±3-5 cm vertical accuracy as standard. Some systems reach ±2 cm with RTK correction.
Speed and coverage. A DJI M300 with Zenmuse L2 covers 2-3 km² per battery at 100m altitude. Ground teams need days for the same area. You finish projects faster and take on more work.
The tradeoff is Cost and complexity. Entry-level LiDAR payloads start around $10,000. Professional rigs like the Zenmuse L2, YellowScan Surveyor Ultra, or Rock Robotic R3 Pro range from $20,000 to $60,000. Flight planning requires terrain-following automation and IMU calibration sequences. Data processing needs specialized software beyond standard photogrammetry tools.
But clients pay for that capability. Utility companies, mining operations, and civil engineering firms budget $500-$1,500 per flight day for LiDAR surveys. Surveyors bill per hectare (rates vary by region, but $150-$400/ha is common). High-accuracy corridor mapping can exceed $2,000/km.
If you're flying DJI M350, M300, or similar platforms, adding LiDAR opens markets that photogrammetry can't touch.
Understanding UAV LiDAR Mapping Technology
Modern UAV LiDAR systems emit between 100,000 to 1.5 million laser points per second. This creates point clouds with densities of 50-1000 points per square meter. At 100m altitude, a sensor firing 300,000 pulses per second and moving at 8 m/s produces roughly 150-200 points per square meter. Double the pulse rate, and density increases proportionally.
Point density matters for different applications. Topographic surveys need 20-50 points/m². Powerline corridor mapping requires 100-200 points/m² to capture wire geometry and vegetation clearance. Detailed infrastructure inspection can demand 500+ points/m² to detect millimeter-scale cracks or surface defects.
The sensor's field of view also affects coverage. Most drone LiDAR systems use a 70° to 105° FOV. Wider angles cover more ground per pass but reduce point density at the edges. Narrow FOV concentrates points in a smaller swath, requiring more flight lines but delivering uniform density.
The Hardware Ecosystem: Sensors & Drone Platforms
To execute successful LiDAR drone mapping projects, professionals need two core components: a specialized LiDAR sensor and a capable drone platform. Choosing the right combination requires understanding the underlying technology.
Understanding Sensor Tech: Solid-State vs. Mechanical
Before selecting a specific model, it is critical to understand the mechanism driving the laser, as this dictates performance and durability. Solid-state systems, using terrestrial laser scanning techniques, are more affordable and durable, making them suitable for projects requiring basic topographic mapping or obstacle detection.
Mechanical systems, though more expensive, offer superior resolution and a broader field of view, making them indispensable for lidar remote sensing in high-precision applications like urban mapping and terrain analysis. Below is a breakdown of how each sensor type works.
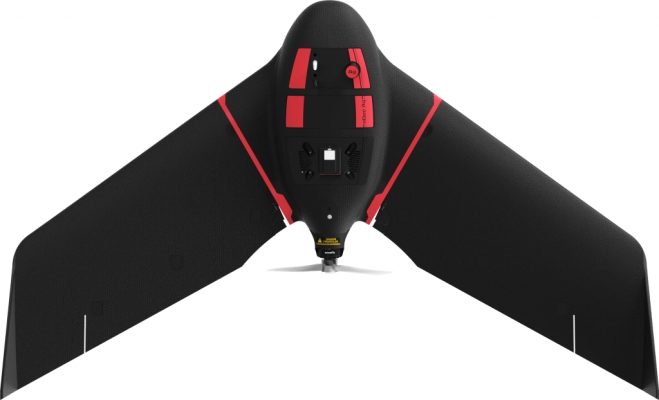
1. Solid-State LiDAR (e.g., DJI Zenmuse L2)
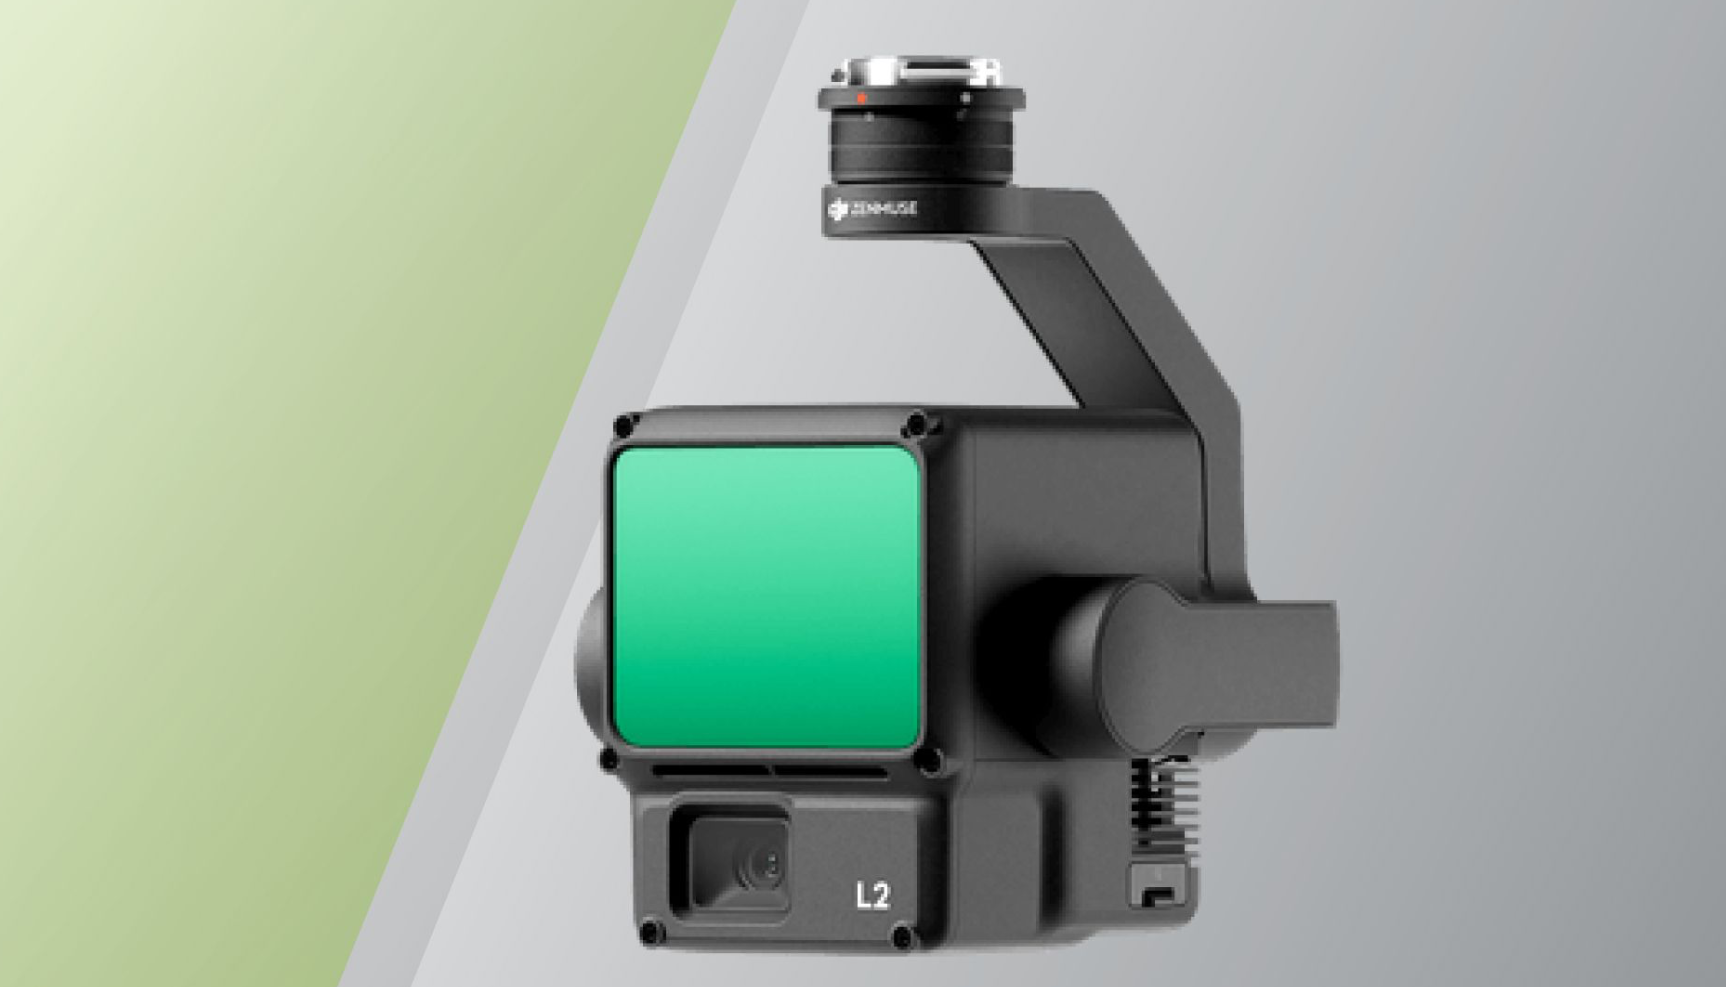
Solid-state LiDAR sensors rely on electronic beam steering (often using phased arrays) rather than moving parts. They are generally more compact, durable, and cost-effective. These systems use coherent detection to steer laser beams electronically, utilizing infrared light to penetrate environments with high accuracy. They penetrate environments with high accuracy, making them ideal for everyday surveying and construction tasks where size, weight, and durability are critical.
2. Mechanical LiDAR (e.g., Riegl VUX-1UAV, Ouster OS1)
| Riegl VUX-1UAV | Ouster OS1 | YellowScan's Surveyor Ultra |
|---|---|---|
 |
 |
 |
| The examples of mechanical LiDAR systems | ||
These systems use rotating mirrors or oscillating lasers to scan a full 360-degree field of view. While they have moving parts, they typically offer superior field of view (FOV) and higher point density. Mechanical sensors are often preferred for high-end corridor mapping or urban planning where a wider swath and extreme detail are required.
LiDAR Sensor Selection for Mapping
The sensor is equally important as the drone platform. Options range from entry-level to survey-grade:
- Entry-Level: Velodyne Puck, YellowScan Mapper (±5cm accuracy, $15,000-$25,000). Suitable for forestry applications, rough topographic surveys, and projects where absolute accuracy matters less than relative measurements.
- Mid-Range: DJI Zenmuse L1/L2, Rock Robotic R2A (±3cm accuracy, $25,000-$40,000). These sensors handle most commercial surveying, powerline inspection, and construction monitoring. The Zenmuse L2 integrates an RGB camera for simultaneous photo capture.
- Professional, survey-grade: RIEGL miniVUX, YellowScan Surveyor Ultra (±1cm accuracy, $60,000-$100,000+). Survey-grade sensors for cadastral work, engineering surveys, and applications requiring highest accuracy. Higher pulse rates (up to 1.5 million points/second) deliver denser point clouds.
Enterprise Drone Platforms for LiDAR Mapping
Your platform must handle the payload weight while providing RTK positioning accuracy.
DJI Enterprise Series
These have become industry standards for several reasons:
- Payload Capacity: Supports heavy LiDAR systems (up to 2.7kg) like the Zenmuse L2 or YellowScan Surveyor without compromising stability.
- Flight Time: Delivers 30-43 minutes of productive survey time with a payload (55 mins max without), depending on conditions.
- Positioning Accuracy: Built-in RTK modules provide centimeter-level precision (1-2 cm horizontal) to eliminate GPS drift.
- Environmental Resilience: IP55 (M350) and IP45 (M300) ratings allow reliable operation in rain and dust.
- Sensor Integration: Native "plug-and-play" compatibility with DJI payloads reduces field setup time.
Top platforms:
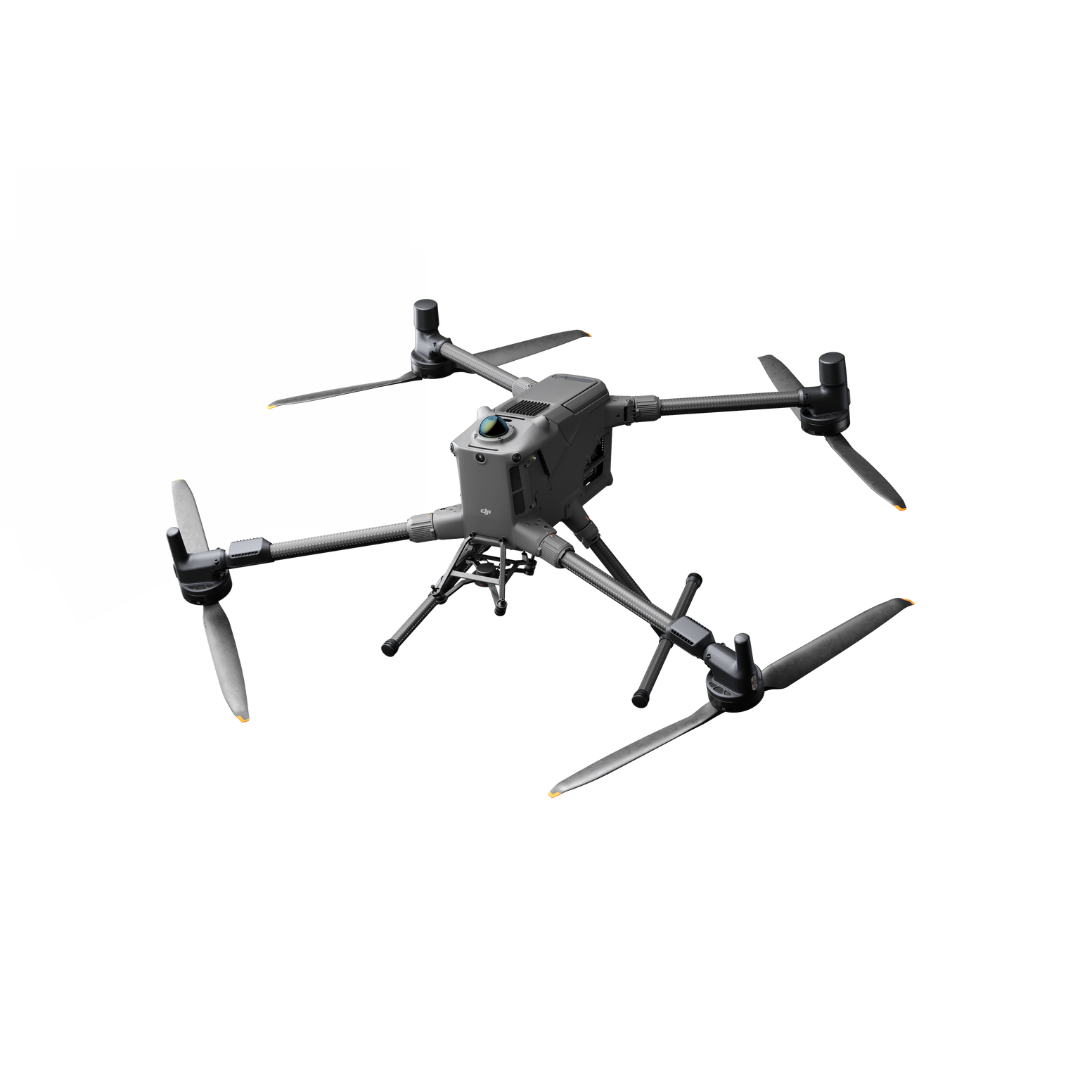
1. DJI Matrice 350 RTK
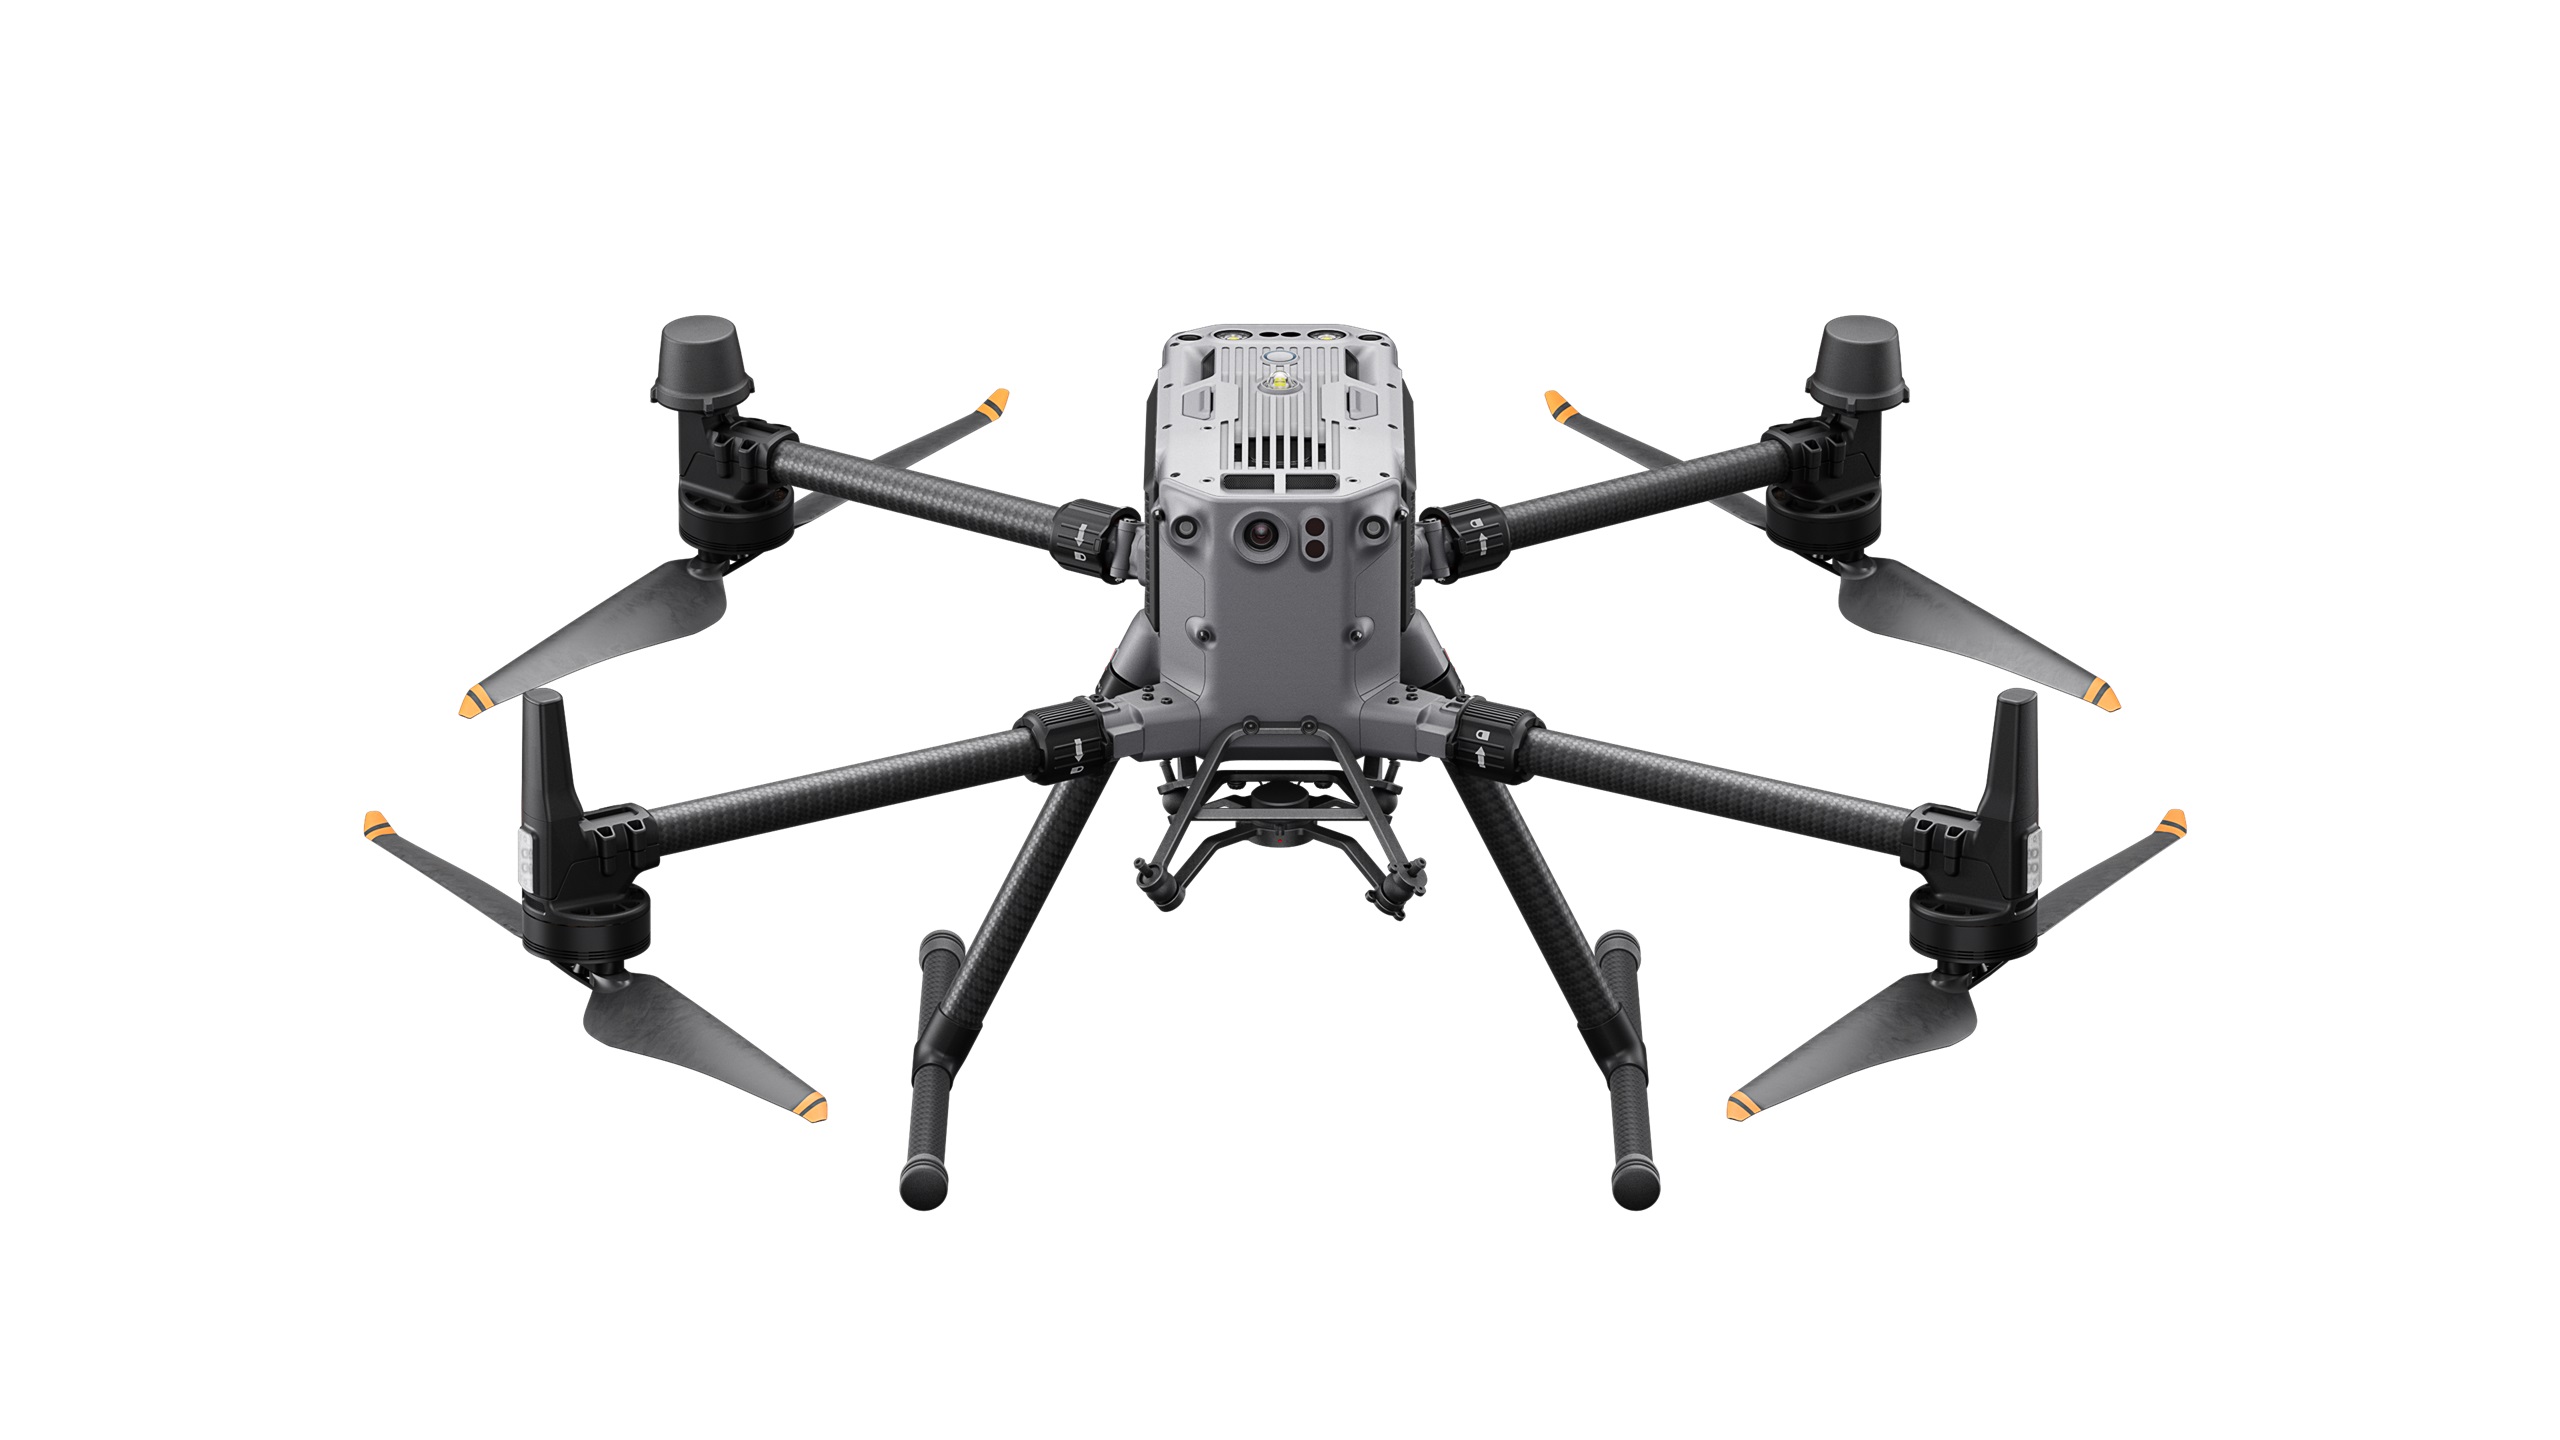
The current flagship for LiDAR operations. It features an IP55 weather rating and an upgraded night-vision FPV camera for low-light safety. The new TB65 hot-swappable battery system is rated for 400 cycles, significantly reducing long-term operating costs compared to previous generations. It supports a max payload of 2.7 kg, making it the standard carrier for the Zenmuse L2.
2. DJI Matrice 300 RTK
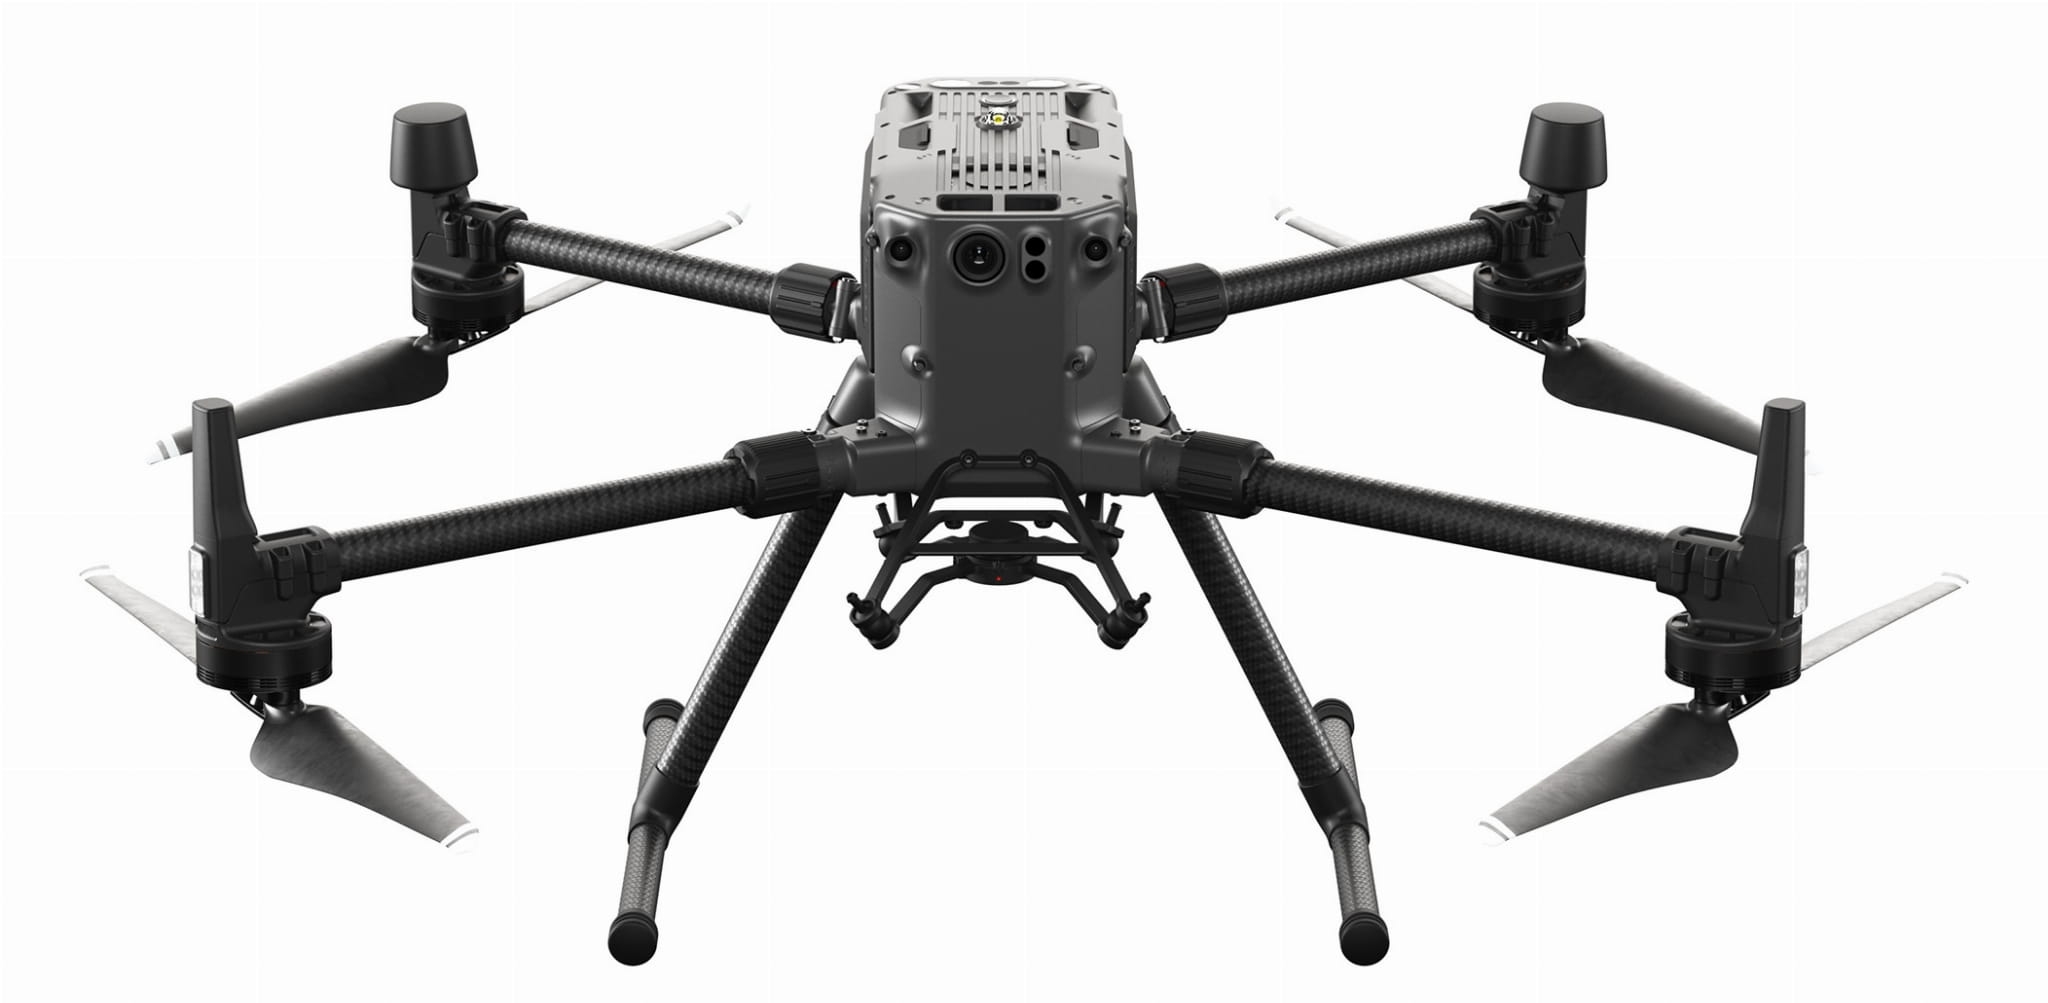
The industry workhorse. While slightly older, it matches the M350’s 55-minute max flight time and 2.7 kg payload capacity. It carries an IP45 rating and remains widely used due to its compatibility with the DJI RC Plus controller and most third-party LiDAR sensors (Rock Robotic, YellowScan).
3. DJI Matrice 400 RTK
A heavy-lift platform designed for complex multi-sensor missions. It boasts a 6 kg payload capacity and a 59-minute flight time, allowing it to carry larger, survey-grade mechanical LiDARs or up to 7 distinct payloads simultaneously. It introduces rotating LiDAR obstacle sensing and mmWave radar for detection of fine obstacles like powerlines.
Alternative Enterprise Drone LiDAR Platforms
While DJI dominates the market, other manufacturers offer compelling alternatives. For large-scale mapping (10+ km²), fixed-wing VTOL drones like the WingtraOne or senseFly eBee X trade hover capability for extended range and speed:
1. Freefly Astro
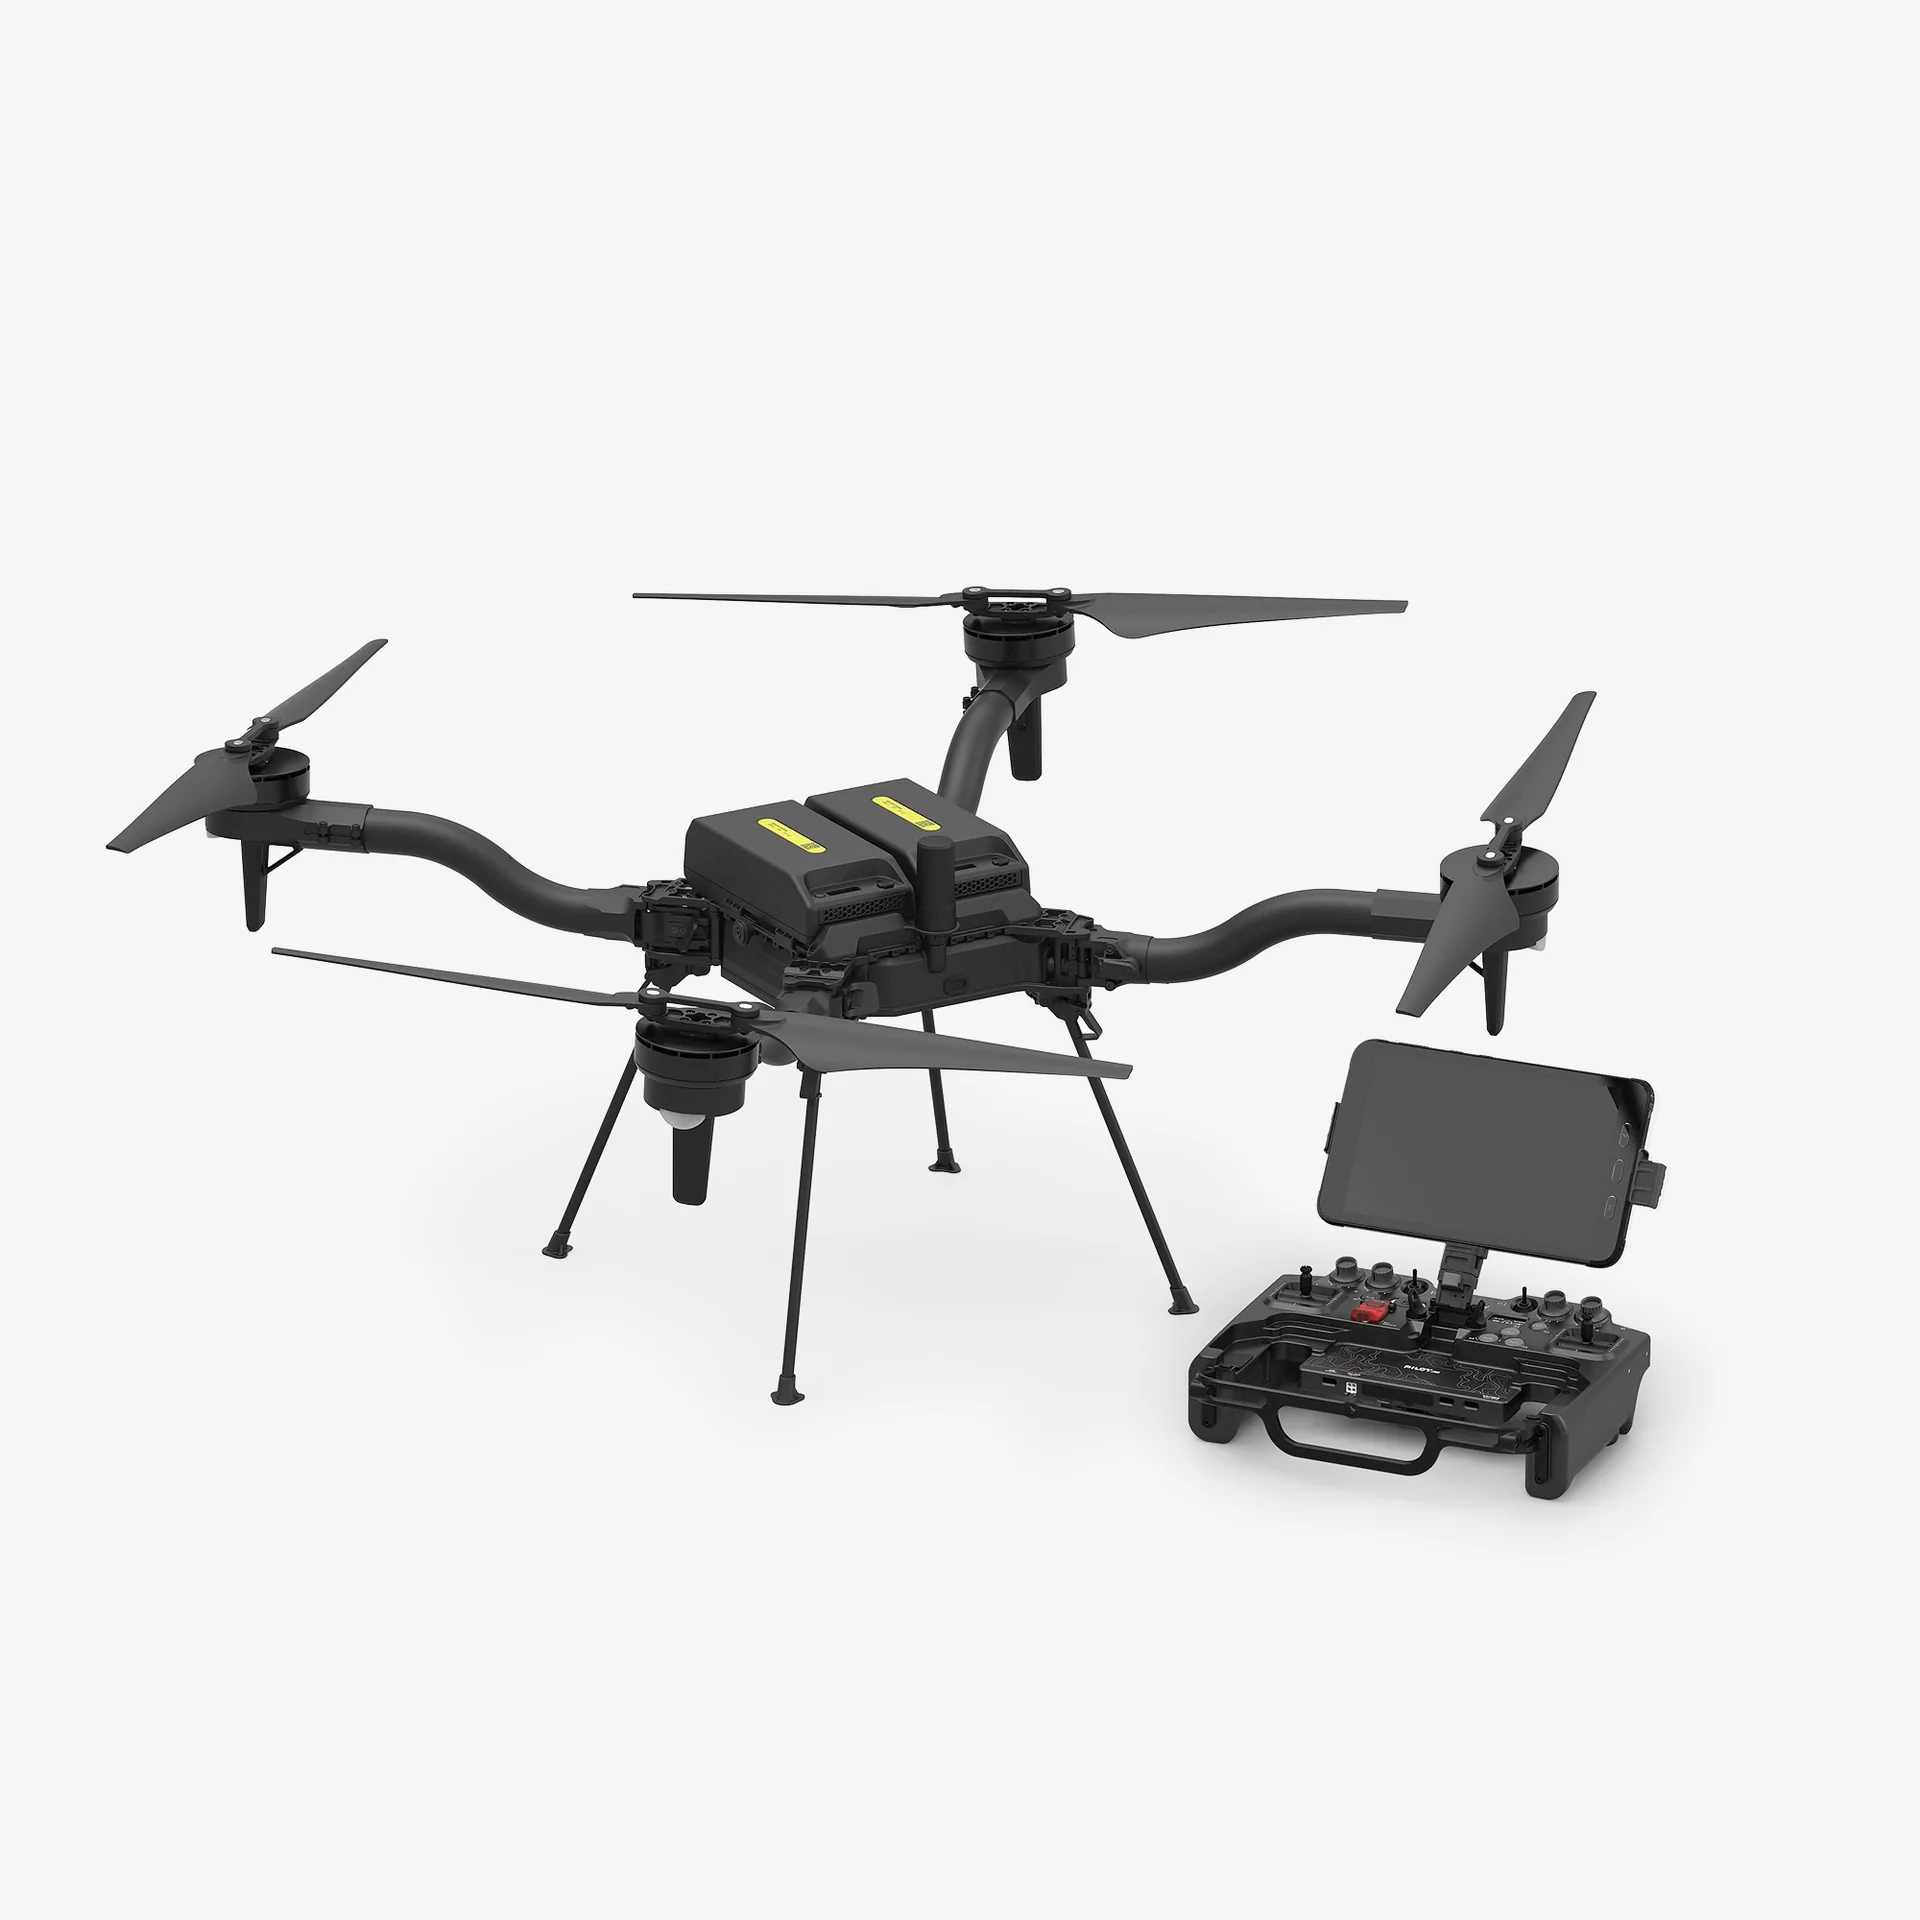
Designed specifically for LiDAR applications with exceptional stability. Eight-rotor configuration provides redundancy. Popular with surveyors flying high-value sensors who need maximum reliability.
2. Acecore Neo
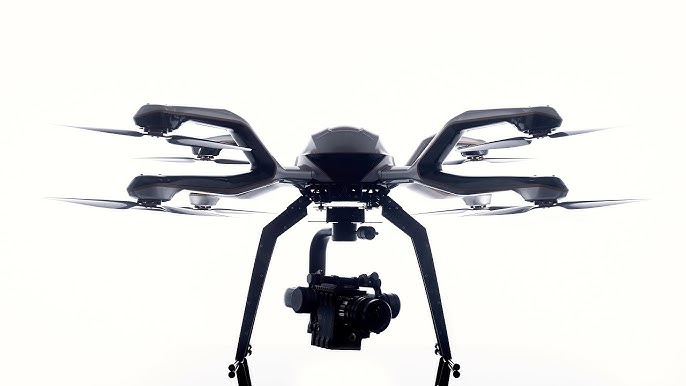
Features longer flight times and higher payload capacity for advanced LiDAR sensors. Modular design allows quick payload swaps. Flight times reach 50-60 minutes with optimized configurations.
3. Wingtra One
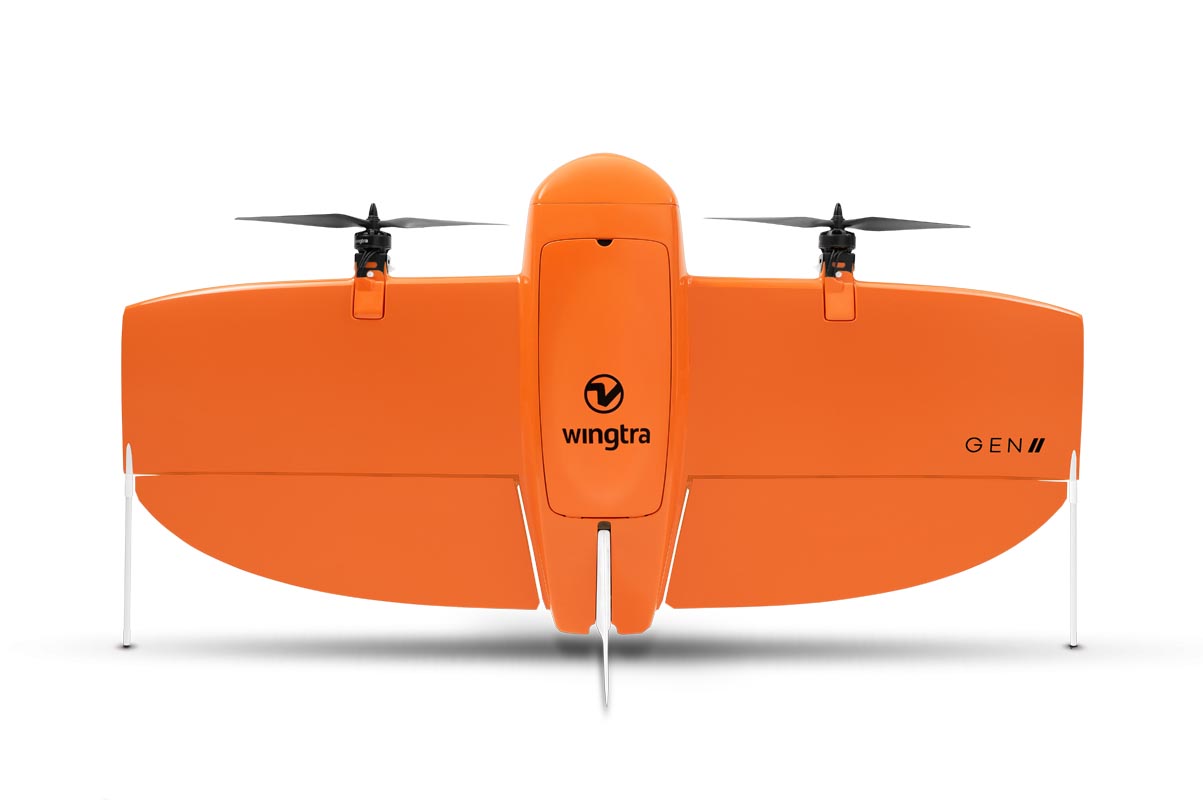
Fixed-wing VTOL design ideal for large-area LiDAR mapping. Covers 10-15 km² per flight at survey altitude. Trades maneuverability for speed and range. Best for corridor mapping and regional surveys where terrain allows higher altitude operations.
4. senseFly eBee X
Another fixed-wing option for photogrammetry and LiDAR. Lightweight sensors only. Covers large areas efficiently but requires launching space and can't navigate tight corridors.
Leading LiDAR Brands for Drone Integration
Several drone LiDAR systems have emerged as leaders in the field. For instance, the DJI Zenmuse L2 offers a powerful combination of a lidar point cloud sensor, high-accuracy IMU, and a camera on a stabilized gimbal. This system is frequently used for generating Digital Elevation Models in fields like construction monitoring and forestry. Another leading model, the Ouster OS1, integrates advanced 3D LIDAR technology, enabling precise terrain and infrastructure mapping.
High-end systems, such as the Riegl VUX-1UAV and YellowScan's Surveyor Ultra, provide advanced capabilities for high-precision surveys. These systems create highly accurate Digital Terrain Models, crucial for mining and environmental monitoring. They utilize laser scanners to capture data at a high point density, ideal for projects requiring intricate details, such as terrain modeling and infrastructure assessment.
This table provides a comparison of various LiDAR models based on key performance parameters, including Weight, Laser Range, Accuracy, Precision, and Shots per Second:
Software for Drone LiDAR Mapping
While standard flight apps like DJI Pilot 2 are excellent for photogrammetry, they often lack the specialized behaviors required for survey-grade LiDAR. Professional operations require a desktop-class mission planner that can handle complex sensor constraints.
UgCS has established itself as the industry standard for these missions because it addresses the specific physics of LiDAR data collection:
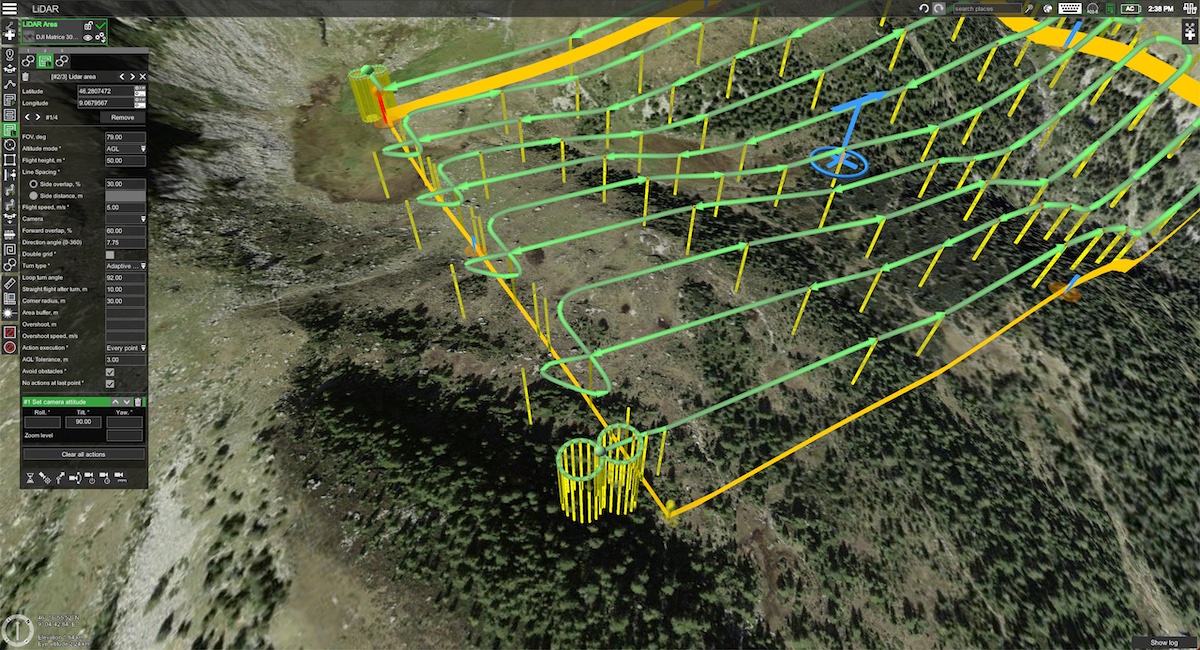
1. True Terrain Following (Constant AGL)
The Challenge: If a drone flies at a fixed altitude (AMSL) over a hill, the distance to the ground decreases. This narrows the sensor's swath width and dangerously increases point density, creating inconsistent data.
The UgCS Solution: UgCS allows you to import high-resolution DEMs (Digital Elevation Models). It automatically calculates a flight path that maintains a precise Above Ground Level (AGL) altitude, ensuring uniform point density and safe clearance over steep terrain.
2. Automated IMU Calibration
The Challenge: LiDAR IMUs drift over time, causing "wavy" or distorted point clouds. Pilots must fly Figure-8 patterns to reset the IMU, but manually flying these is imprecise and easy to forget.
The UgCS Solution: The software automatically inserts Figure-8 calibration loops into the flight path at critical intervals (mission start, end, and every 20-30 minutes), ensuring data integrity without pilot intervention.
3. LiDAR-Specific Area & Corridor Tools
The Challenge: Calculating flight lines based on overlap is standard for cameras, but LiDAR requires calculations based on Field of View (FOV) and Point Density.
The UgCS Solution: The built-in LiDAR toolset calculates your optimal flight speed, altitude, and line spacing based on your specific sensor's FOV and your client's required point density (points/m²). This eliminates the guesswork of spreadsheet calculations.
4. Offline & Remote Capability
The Challenge: High-value LiDAR jobs (forestry, mining, pipelines) often occur in remote zones with no cellular coverage.
The UgCS Solution: UgCS offers full offline functionality. You can cache maps and elevation data on your laptop or controller before heading to the field, ensuring you can plan and adapt missions anywhere.
UgCS has established itself as a leading solution for LiDAR drone missions with features specifically designed for this application. The platform offers tiered versions to match different operational needs:
- UgCS Open: Free version limited to two daily routes (250m each), ideal for testing and small projects. Test the software's LiDAR planning tools before committing to a paid license.
- UgCS Expert: Comprehensive toolset for professional LiDAR operations. Unlimited route length and daily missions. Includes full LiDAR toolset, terrain following, and calibration automation.
- UgCS Enterprise: Advanced features for large-scale mapping operations. Multi-user collaboration, cloud sync, and fleet management capabilities.
Industry Applications of LiDAR Mapping Drones
LiDAR drone mapping delivers fast, safe, cost-efficient capture of highly accurate, high-density 3D terrain/structure data, even through vegetation and over hard-to-reach areas. It outperforms most ground surveys and photogrammetry in precision and reliability.
Here's where professional pilots bill premium rates with LiDAR payloads:
1. Construction and Land Surveying
Civil engineers need digital elevation models (DEMs) before breaking ground. Surveyors deliver contour maps, cross-sections, and cut/fill volumes for earthwork planning. Ground crews with total stations need days to survey 10 hectares. A drone with LiDAR covers that in two flights.
Applications of LiDAR drones in construction and land surveying:
- Site preparation surveys. Developers need existing conditions before design work starts. LiDAR captures terrain with sub-5 cm vertical accuracy. Import the point cloud into Civil 3D or 12d Model. Engineers design grading plans directly from your data.
- Progress monitoring. Construction managers track earthwork volumes weekly. Compare baseline and current point clouds. Software calculates cut and fill volumes automatically. Contractors verify subcontractor work and prevent billing disputes. Typical billing: $800-$1,500 per flight for weekly monitoring.
- Stockpile volumetrics. Mining and aggregates operations need inventory counts. LiDAR captures pile geometry regardless of material color or texture (coal, gravel, ore). Surveyors bill per stockpile or monthly subscription. A quarry with 15 piles pays $300-$500 monthly for weekly surveys.
- As-built documentation. Final surveys verify construction matches design. LiDAR captures roads, drainage, and grading. Deliverables include contour maps at 0.25m or 0.5m intervals, spot elevations, and deviation analysis from design surface.
The key advantage over photogrammetry? Bare-earth accuracy on disturbed sites. Construction zones have mud, standing water, and minimal vegetation. Photogrammetry struggles without visual texture. LiDAR measures elevation directly.
2. Forestry and Environmental Monitoring
Forest managers pay for data ground crews can't collect efficiently. Timber companies need stand metrics across thousands of hectares. Environmental consultants map wetlands and monitor restoration projects.
Applications of LiDAR drones in forestry and environmental monitoring:
- Timber inventory and cruise. Traditional forest inventory samples 2-5% of a stand using plot measurements. Foresters extrapolate to the full area, introducing error. LiDAR scans 100% of the canopy. Software derives tree height, canopy closure, and basal area from the point cloud. Timber cruisers use this for volume estimates and harvest planning. A single sensor records multiple returns per pulse. First return captures treetops. Intermediate returns map branch structure. The last return hits the ground. Classify returns by height to separate ground, understory, mid-story, and canopy layers.
- Carbon stock assessment. Conservation projects and carbon credit programs need biomass estimates. LiDAR-derived canopy metrics correlate with above-ground biomass. Analysts apply allometric equations specific to species and region. Accuracy improves when LiDAR data combines with field-sampled calibration plots.
- Wetland delineation. Wetland boundaries depend on micro-topography (elevation changes of 10-30 cm). Traditional surveys require walking transects with GPS and staff. LiDAR captures bare-earth elevation under vegetation. Hydrologists import the DEM into GIS, model water flow, and delineate jurisdictional boundaries.
- Coastal erosion monitoring. Repeat surveys detect shoreline changes. Compare point clouds from different years. Software calculates volumetric loss or accretion. Coastal managers use this for restoration planning and infrastructure risk assessment.
The penetration capability matters here. Forest canopies block 80-95% of sunlight. Photogrammetry can't see the ground. LiDAR pulses slip through gaps. You get bare-earth DEMs even under dense canopy. Typical point density: 10-20 ground returns per square meter under mature forest.
3. Infrastructure Inspections
Utilities and transportation agencies inspect thousands of kilometers of linear infrastructure annually. Powerline corridors cross mountains and forests. Pipelines run through remote terrain. Railways need clearance verification and embankment monitoring.
Applications of LiDAR drones in infrastructure inspections:
- Powerline corridor surveys. Electric utilities need vegetation clearance analysis. Regulations mandate minimum distances between conductors and trees. LiDAR captures both wire geometry and vegetation structure in one flight. Fly the corridor at 60-80m altitude, 5-8 m/s ground speed. Process the point cloud to classify wires, towers, and vegetation. Software measures clearance distances automatically. Output identifies trees requiring trimming with GPS coordinates for ground crews. Utilities bill this per kilometer of corridor or per tower span. Rates vary: $50-$150 per km for basic surveys, up to $300/km for detailed analysis including tower structural assessment.
- Pipeline right-of-way monitoring. Oil and gas operators monitor pipelines for third-party intrusion, erosion, and ground movement. LiDAR detects unauthorized construction, vegetation encroachment, or terrain changes that threaten buried infrastructure.Repeat surveys (annual or semi-annual) reveal ground subsidence, washouts, or slope instability. Compare point clouds to measure vertical displacement. Operators prioritize inspection of high-risk segments.
- Railway corridor clearance. Rail operators need structure gauge verification. Signals, platforms, and bridges must maintain clearance envelopes around tracks. LiDAR surveys capture track geometry and adjacent structures. Engineers verify clearances meet standards and identify encroachments.
- Bridge inspection. Traditional inspections use bucket trucks, scaffolding, or rope access. LiDAR captures bridge underside geometry, pier structure, and approaches without physical access. Point clouds document existing conditions. Repeat surveys track deflection, settlement, or structural deformation.
The value proposition here is simple: drones fly faster and safer than ground crews or helicopters. A helicopter powerline survey costs $2,000-$5,000 per hour. Drone LiDAR runs $500-$1,500 per day and covers comparable distances.
4. Archaeology and Heritage Preservation
Archaeologists use LiDAR to detect features invisible at ground level. Ancient settlements, roads, and field systems leave subtle topographic signatures. Elevation differences of 20-50 cm reveal structures buried under soil or vegetation.
Applications of LiDAR drones in archaeology and heritage preservation:
1. Archaeological site discovery:
LiDAR has rediscovered Maya cities under Central American jungle, medieval villages in European forests, and prehistoric earthworks in North America. The technology strips vegetation digitally, revealing micro-topography that indicates human activity. Research teams fly LiDAR over known archaeological zones. Analysts process the point cloud to generate a bare-earth DEM. Hill-shading and slope analysis highlight linear features (roads, walls) and mounds (building foundations, burial sites).
Examples:
- LiDAR Drone Mapping in Spain: 36 Archaeological Sites Discovered with UgCS
- Advancements in Archaeological Surveys: Drone-Based Magnetometry at the Roman Fortress of Theilenhofen
- GPR and Magnetometry Drone Surveys Reveal Unexplored Archaeological Features at Remote Mimbres Site
- GPR+drone integrated system for Archaeological investigation of Inca ruins
2. Cultural heritage documentation:
Historic buildings, monuments, and landscapes require detailed records for preservation and restoration. LiDAR produces millimeter-accurate 3D models. If structures collapse or suffer damage, architects have precise geometric data for reconstruction.
Combined RGB and LiDAR surveys deliver both geometry and texture. The point cloud provides measurements. Photos supply visual detail. Together, they create complete digital archives.
Examples:
- How Ileron Transformed DJI Drones into Precision Aerial Survey Tools with UgCS Flight Planning Software
- Korea Heritage University: 61% Faster Hyperspectral Imaging Through Integrated Gimbal and Flight Control System
- GPR and Magnetometry Drone Surveys Reveal Unexplored Archaeological Features at Remote Mimbres Site
3. Landscape analysis
LiDAR reveals historical land use patterns. Old field boundaries, drainage systems, and terraces show up in the bare-earth DEM. Historians use this data to understand past agricultural practices and settlement patterns.
The penetration capability matters in archaeological surveys just as in forestry. Ancient sites are often covered by vegetation. LiDAR penetrates forest canopy to reveal ground features that would otherwise require ground-clearing for traditional survey methods.
How to Plan a Perfect LiDAR Drone Survey
LiDAR drone survey missions require more preparation than standard photogrammetry flights. You're maintaining precise altitude over changing terrain while ensuring proper sensor calibration. Here's how to execute clean surveys that deliver usable data.
Step 1: Define Survey Parameters
Start with your deliverable requirements. What does the client need?
Point density: Construction surveys need 50-100 points/m². Forestry applications work with 10-20 points/m². Powerline inspections require 100-200 points/m². Infrastructure detail work demands 300+ points/m².
Accuracy requirements: Topographic surveys typically specify ±5 cm vertical accuracy. Engineering surveys might require ±2-3 cm. Check your sensor specifications. Entry-level sensors deliver ±5 cm. Survey-grade systems reach ±1-2 cm with proper calibration and RTK correction.
Coverage area: Measure the survey zone. A 50-hectare site at 80m altitude with 60% sidelap needs roughly 8-10 flight lines. Calculate battery requirements. Each battery provides 30-35 minutes of productive flight time.
Terrain complexity: Flat sites are straightforward. Rolling terrain needs terrain-following automation. Steep slopes or cliffs require careful altitude management to maintain safe clearance while keeping point density consistent.
Step 2: Select Flight Parameters
Your sensor specifications drive flight planning calculations.
- Altitude above ground: Most LiDAR surveys fly 50-100m AGL. Higher altitude covers more area per flight but reduces point density. Lower altitude increases density but requires more flight lines and battery changes.
- Calculate coverage width using your sensor's field of view. A 70° FOV at 80m altitude covers roughly 100m width. A 105° FOV covers 145m at the same altitude.
- Flight speed: Faster flight reduces survey time but lowers point density. Typical speeds: 5-8 m/s for detailed surveys, 8-12 m/s for reconnaissance work.
- Point density calculation: (Pulse rate × FOV coverage) ÷ (Flight speed × Line spacing). A sensor firing 300,000 pulses/second at 80m altitude (100m swath) flying 8 m/s with 60m line spacing produces approximately 62 points/m².
NOTE: This is a simplified estimation. Actual density varies based on scanner mirror speed and overlap settings. Always verify in UgCS during planning.
- Line spacing and overlap: Standard practice uses 30-50% sidelap. This ensures coverage gaps don't occur and provides overlap for accuracy verification. A 100m swath width with 40% overlap means 60m line spacing.
- Flight direction: Fly perpendicular to terrain slope when possible. This maintains a more consistent AGL than flying up and down slopes. For corridor surveys, fly parallel to the feature (powerline, pipeline, road).
Real-world example: A powerline survey flown with 20% overlap in 10 m/s winds experienced 5-8m lateral drift. Several sections had no coverage. The operator re-flew 40% of the corridor. Using 40% overlap initially would have saved time and client frustration.
Step 3: Prepare Terrain Data
Accurate terrain following requires quality elevation data.
Elevation data sources: Default datasets like SRTM (30m resolution) or ASTER (30m resolution) work for gentle terrain. For complex topography, use higher resolution data:
- USGS 3DEP (1-10m resolution, USA)
- Copernicus DEM (10-30m resolution, global)
- Local lidar datasets from previous surveys
- Photogrammetry-derived DEMs from preliminary flights
Import terrain data into your flight planning software. Preview the elevation profile along your planned flight lines. Look for sudden elevation changes that might create clearance issues or excessive altitude variations.
Terrain following settings: Set your desired AGL height. Software calculates the 3D flight path automatically. For survey work, maintain constant AGL (±5m variation). This keeps point density consistent across the survey area.
Add altitude buffers for obstacles. If the terrain has towers, trees, or structures, add 20-30m clearance to your base AGL setting in those zones.
Step 4: Plan IMU Calibration Patterns
LiDAR sensors contain Inertial Measurement Units (IMUs) that track sensor orientation. IMU drift over time introduces errors in point cloud geometry. Calibration flights correct this drift.
When to calibrate:
- Before starting the survey (always)
- After battery changes on long missions
- Every 20-30 minutes of flight time for highest accuracy
- After the survey (recommended for professional work)
Calibration patterns: Figure-8 patterns work for most sensors. Fly two overlapping circles. This exposes the IMU to varied orientations and helps the sensor's processing software calculate correction parameters.
Some sensors specify calibration box patterns (fly a rectangular pattern with turns). Check your sensor documentation for recommended procedures.
Flight planning software should automate this. Insert calibration actions at mission start. The drone flies the pattern, then proceeds to survey lines.
Step 5: Build the Flight Plan
Use desktop flight planning software for anything beyond simple area scans.
For area surveys:
- Draw the survey boundary polygon on the map
- Enter desired point density or manually set altitude, speed, and line spacing
- Set flight direction (perpendicular to terrain slope or prevailing wind)
- Enable terrain following and load elevation data
- Add IMU calibration patterns at start and end
- Set camera actions if your sensor includes RGB capability
- Review the 3D flight path for altitude conflicts or coverage gaps
For corridor surveys:
- Import the corridor centerline (KML, CSV, or draw manually)
- Set corridor width (typically 50-200m depending on feature)
- Configure flight parameters (altitude, speed, line spacing)
- Enable terrain following
- Add calibration patterns
- Split the mission at battery change points if needed
Mission validation: Preview the elevation profile. Look for sections where AGL varies significantly. Adjust altitude settings if terrain changes force large variations. Check total flight time against battery capacity. Add 20% buffer for wind, temperature effects, and reserve.Export the mission to your controller or field tablet.
Step 6: Pre-Flight Checks
Field preparation prevents mission failures.
Equipment checks:
- Verify drone battery charge (all batteries)
- Check LiDAR sensor battery level (if separate from drone power)
- Confirm RTK base station setup or NTRIP connection
- Test controller-to-drone communication
- Verify SD card capacity for data storage
- Check propeller condition and mounting
Environmental assessment:
- Wind speed at altitude (limit: 10-12 m/s for most platforms)
- Visibility for visual line of sight requirements
- Airspace authorization if required
- Obstacle identification near flight path
Mission rehearsal: Load the flight plan. Review the path on the controller. Verify takeoff and landing points are clear. Confirm altitude settings make sense for visible terrain.
Step 7: Execute the Mission
Launch and monitor the automated flight.
Takeoff: Most software starts missions from takeoff point. The drone climbs to mission altitude, flies to the first waypoint, executes calibration pattern, then begins survey lines.
Monitoring: Watch AGL height during flight. Verify the sensor is recording (check LED indicators or telemetry). Monitor battery level. Most platforms trigger return-to-home automatically at 25-30% battery.
Battery changes: For multi-battery missions, land when prompted. Swap battery. Relaunch. The software resumes from the last completed segment or waypoint.
Data verification: After landing, check that data files are recorded properly. LiDAR sensors save point cloud data to onboard storage. Verify file sizes are reasonable for flight duration. Don't delete anything until you've processed and validated the data.
Step 8: Post-Flight Calibration (Optional but Recommended)
Fly another calibration pattern after completing survey lines. This helps sensor processing software refine IMU corrections. The difference between pre-flight and post-flight calibration data reveals IMU drift during the mission.
Some processing workflows require both calibrations. Check your sensor manufacturer's recommendations.
Advanced Tips for UAV LiDAR Mapping Success
LiDAR missions succeed or fail based on planning details most operators overlook. Here's what separates clean, usable data from expensive re-flights.
Technical Optimization
Optimal Flying Height
Balance coverage efficiency against point density requirements. Most commercial work operates at 40-80m AGL.
40-60m altitude: Delivers 150-300 points/m² with typical sensors (300,000-600,000 pulse rate). Use this height for detailed infrastructure inspections, dam surveys, or archaeology work where you need to detect small features.
60-80m altitude: Produces 75-150 points/m². Suitable for topographic surveys, forestry applications, and powerline corridor mapping. Covers more ground per flight. Most survey work happens in this range.
80-120m altitude: Yields 30-75 points/m². Acceptable for reconnaissance surveys, preliminary site assessment, or applications where relative measurements matter more than absolute detail. Maximizes area coverage per battery.
Higher altitude reduces flight time but remember: point density drops with the square of altitude. Double your height, and density falls to 25% of original values. A sensor producing 200 points/m² at 50m drops to 50 points/m² at 100m.
Speed Considerations
Flight speed directly affects point density along the flight direction.
Slow (3-5 m/s): Increases point density and improves feature detection. Use slower speeds for corridor surveys where you need to capture small objects (powerline hardware, pipeline markers). Also beneficial in steep terrain where terrain-following system needs response time.
Medium (5-8 m/s): Standard for most survey work. Good balance between coverage efficiency and data quality. Most professional operators fly in this range.
Fast (8-12 m/s): Reduces point density but covers large areas quickly. Acceptable for reconnaissance work or projects where point density requirements are modest (20-50 points/m²).
Calculate actual point density before flying. A sensor firing 300,000 pulses per second flying 5 m/s with 60m line spacing produces a different density than the same sensor at 10 m/s. Software should calculate this automatically based on your flight parameters.
Weather Impact
LiDAR performs better than photogrammetry in overcast conditions, but weather still affects operations.
Optimal conditions: Overcast skies, light wind (under 8 m/s), dry air. Clouds don't affect laser returns. You can fly all day without worrying about sun angle or shadows.
Acceptable conditions: Partly cloudy, winds 8-12 m/s. Monitor altitude-hold performance. Stronger winds reduce battery life by 15-25%.
Avoid: Rain, fog, snow, winds over 15 m/s. Water droplets scatter laser pulses and reduce effective range. Heavy rain can cut the maximum range by 30-40%. Fog blocks returns entirely.
High winds destabilize the platform and degrade IMU performance.
Temperature affects range slightly. Cold air is denser, increasing range by 2-3%. Hot air decreases it proportionally. This matters for sensors operating near maximum range specifications.
Battery Management
Cold temperatures significantly reduce flight time. LiPo batteries lose 20-30% capacity below 10°C and 40-50% capacity below 0°C.
Cold weather protocol:
- Store batteries at room temperature until field deployment
- Use battery warming bags or keep batteries inside your vehicle heater
- Warm batteries to 20-25°C before installation
- Launch immediately after installing warm batteries
- Expect 25-30% shorter flight times in freezing conditions despite warming
Plan battery counts accordingly. A site requiring 4 batteries in summer might need 6 batteries in winter. Keep spares warm in a heated vehicle between flights.
RTK and Positioning Accuracy
LiDAR accuracy depends on positioning quality. Most enterprise drones include RTK (Real-Time Kinematic) GNSS receivers.
RTK setup options:
NTRIP correction: Connect to internet-based correction networks. Requires cellular coverage. Accuracy: 1-2 cm horizontal, 2-3 cm vertical.
Base station: Set up your own RTK base at a known point. Works in areas without cellular coverage. Accuracy: 1-2 cm horizontal, 2-3 cm vertical. Requires base receiver equipment (additional $3,000-$8,000 investment).
PPK (Post-Processed Kinematic): Process positioning data after flight using base station logs. Same accuracy as RTK but doesn't require radio link during flight. Adds processing steps but works in challenging RF environments.
For highest accuracy, establish Ground Control Points (GCPs) and use them to verify point cloud accuracy. Even with RTK, GCPs improve confidence in deliverables for critical applications.
Common Mistakes to Avoid
Insufficient Calibration
Skipping proper IMU calibration leads to wavy or distorted point clouds. The sensor's internal gyroscopes and accelerometers drift during flight. Calibration patterns expose the IMU to varied orientations so processing software can calculate correction factors.
Symptoms of poor calibration:
- Point clouds appear wavy or rippled
- Buildings lean or appear twisted
- Ground surfaces show systematic undulation
- Vertical features (walls, trees) appear tilted
Fix: Always calibrate before survey flights. For missions longer than 30 minutes, add mid-flight calibration patterns. Fly post-flight calibration for professional deliverables. Some sensor manufacturers' processing software requires both pre and post calibrations for optimal results.
Inadequate Overlap
Using less than 30% overlap between flight lines creates gaps in UAV LiDAR data. Wind drift, GPS errors, or terrain variations push the actual flight path away from planned routes. Insufficient overlap means these deviations create data gaps.
Fix: Use 40% overlap as standard practice. Increase to 50-60% in windy conditions or challenging terrain. The time investment is small compared to re-flight costs.
Ignoring Ground Control
While LiDAR with RTK delivers excellent absolute accuracy, GCPs still improve confidence for critical applications. Engineering surveys, cadastral work, and projects requiring third-party verification benefit from GCP validation.
GCP placement: Distribute 4-6 points around survey perimeter and 1-2 interior points for sites under 50 hectares. Larger sites need proportionally more GCPs.
Target accuracy: survey-grade GPS (±2 cm) for professional deliverables.
GCP use: Process the point cloud with RTK positions. Then measure GCP coordinates in the point cloud. Compare to field-measured positions. Discrepancies reveal systematic errors. Many processing packages allow point cloud adjustment using GCPs as control.
Rushing Post-Processing
Taking time to properly classify points and filter noise dramatically improves deliverable quality. Raw LiDAR point clouds contain noise from birds, insects, atmospheric returns, and multipath errors.
Processing workflow:
- Import and verify: Load raw point cloud. Check coverage, point density, and verify no data gaps exist.
- Noise filtering: Remove outliers (points far above or below local surface). Most software provides automatic noise filters. Inspect results and manually remove remaining obvious errors.
- Ground classification: Separate ground returns from vegetation, buildings, and other features. This is critical for bare-earth DEM generation. Automated classification works on gentle terrain. Complex sites need manual verification and editing.
- Feature extraction: Classify buildings, vegetation, powerlines, or other features relevant to project deliverables. Quality classification makes data useful for clients.
- Accuracy verification: If you established GCPs, measure them in the point cloud. Calculate RMS error. Professional deliverables should include accuracy statements
- Deliverable generation: Export classified point clouds, DEMs, contour maps, or other products per client specifications.
Allocate processing time appropriately. A 50-hectare survey with 100 points/m² takes 4-8 hours to process properly, including classification review and editing. Rushing through classification in 1-2 hours produces inferior deliverables.
Poor File Management
LiDAR projects generate large datasets. A single flight creates 2-10 GB of raw sensor data. Multi-flight projects with RGB imagery included can exceed 50-100 GB.
File management protocol:
- Copy raw data from sensor to computer immediately after landing
- Verify file integrity before deleting sensor storage
- Maintain organized folder structure (Client/Project/Date/Flight)
- Keep raw data archived even after processing
- Back up to separate physical drives or cloud storage
Lost data means complete re-flight. Invest in proper storage and backup systems.
Ignoring Manufacturer Processing Requirements
Different LiDAR sensors have specific processing workflows. Some require proprietary software for initial processing before exporting to standard formats. Others work directly with third-party tools.
Read your sensor manual's processing section. Using incorrect processing workflows degrades accuracy or introduces artifacts. Manufacturer software often includes calibration refinement tools that improve results significantly.
Flying Too High for Project Requirements
Altitude seems like free efficiency, but point density constraints determine usable maximum altitude.
Example: A client requests 100 points/m² for a construction survey. Your sensor fires 300,000 pulses per second with 70° FOV. At 80m altitude with standard flight parameters, you deliver 75 points/m². The deliverable fails client specifications.
Fix: Calculate required altitude before planning missions. Work backward from point density requirements. Verify your planned parameters deliver the specified density. Software should calculate this automatically, but verify the math yourself.
Not Testing Processing Workflow
Process a small test section before committing to large projects. Verify your processing software handles your sensor's data format. Confirm classification tools work on your terrain type. Test deliverable export formats match client requirements.
A test flight over 5-10 hectares reveals workflow issues before you fly 500 hectares and discover problems during processing.
Why LiDAR Mapping Is the Future for Drone Pilots
The commercial drone industry is splitting into two tiers. Basic aerial photography and simple mapping compete on price. Operators undercut each other for commodity work. LiDAR sits in a different market entirely.
Clients hiring LiDAR services need data that cameras can't capture. They have budgets that reflect this requirement. Mining operations pay $1,500-$3,000 per day for stockpile surveys. Utilities budget $100-$300 per kilometer for powerline corridor mapping. Engineering firms bill $150-$400 per hectare for topographic surveys with LiDAR data.
he work exists because ground-based alternatives cost more and take longer. Traditional land surveying costs $2,000-$5,000 per day for a two-person crew with limited coverage. Helicopter LiDAR runs $3,000-$8,000 per hour. Drones deliver comparable data quality at a fraction of the cost.
Market Growth Drivers
Several industries are increasing LiDAR adoption rapidly:
Renewable energy expansion. Solar and wind projects need terrain surveys before construction. Developers assess hundreds of potential sites. LiDAR provides fast, accurate elevation data for engineering analysis. A single wind farm site survey generates $5,000-$15,000 in revenue for 2-3 days of field work.
Infrastructure aging. The US has 617,000 bridges, many built 50-70 years ago. Transportation agencies need condition assessments. Traditional inspection methods require lane closures, scaffolding, or rope access. LiDAR surveys capture structure geometry safely from the air. State DOTs are allocating budgets specifically for drone-based infrastructure assessment.
Mining modernization. Mining operations measure stockpiles weekly or monthly for inventory control. Ground surveys with total stations take days and expose personnel to haul truck traffic. LiDAR operators fly the same sites in hours with zero ground personnel exposure. Mines pay monthly retainers for this service.
Forestry and carbon markets. Carbon credit programs need biomass measurements for verification. LiDAR provides wall-to-wall coverage of forest stands. Traditional plot sampling covers 2-5% of the area. LiDAR scans 100%. Forestry consultants and carbon project developers are major clients for this application.
Regulatory push for better data. Environmental regulations increasingly require detailed terrain and vegetation data. Wetland delineation, floodplain mapping, and habitat assessment all benefit from LiDAR's ability to map ground surface under vegetation. Environmental consulting firms are adopting LiDAR for these applications.
Technology Accessibility
LiDAR barriers to entry have dropped significantly. Five years ago, professional LiDAR sensors cost $100,000-$200,000. Today, capable systems start at $25,000. DJI's Zenmuse L1 and L2 brought survey-grade LiDAR to the M300/M350 platform at prices small operators can justify.
Processing software has also improved. Cloud-based tools like DJI Terra simplify workflows. Desktop applications like QGIS (free) and CloudCompare (free) handle basic classification and analysis. You don't need $10,000 software licenses to deliver professional results.
Flight planning automation makes complex missions manageable. Software like UgCS handles terrain following, calibration patterns, and multi-battery missions automatically. What required expert pilots five years ago is now accessible to operators with standard commercial drone experience.
Building a LiDAR Service Business
Successful LiDAR operators focus on specific verticals. Don't market generic "drone LiDAR services." Target industries with clear needs:
For construction and surveying: Partner with engineering firms and general contractors. Offer volume tracking, progress monitoring, and as-built documentation. Build relationships with 3-5 regular clients who need monthly or quarterly surveys.
For utilities: Approach electric cooperatives and transmission companies. Powerline corridor mapping generates recurring revenue. Once you've surveyed a utility's network, they return annually or bi-annually for vegetation management updates.
For forestry: Contact timber companies, conservation organizations, and carbon project developers. Forest inventory and biomass assessment work comes in large blocks (500-5,000 hectares). Single projects generate $15,000-$50,000 in revenue.
For mining and aggregates: Stockpile measurement is steady, predictable work. Quarries and mines need weekly or monthly surveys. A single site generates $1,200-$2,000 monthly. Sign up 3-4 sites and you have baseline recurring revenue.
The key differentiation? You can deliver data these clients need that photogrammetry operators can't provide. Market this capability directly. Show point cloud samples from under forest canopy. Demonstrate bare-earth DEMs from vegetated sites. Present before/after volume calculations from stockpile surveys.
Investment and ROI
A professional LiDAR setup requires capital investment:
- Enterprise drone platform: $10,000-$15,000 (M300/M350)
- LiDAR sensor: $25,000-$40,000 (Zenmuse L2, mid-range alternatives)
- Flight planning software: $0-$3,000 annually (UgCS tiers)
- Processing software: $0-$5,000 (depends on applications)
- Additional batteries and accessories: $2,000-$4,000
Total investment: $40,000-$65,000 for a capable system.
Revenue potential justifies this investment quickly. A utility corridor survey generates $8,000-$15,000 for 3-5 days of work (planning, flying, processing). A mining client paying $1,500 monthly generates $18,000 annually. Three to four regular clients cover your equipment investment in the first year.
Compare this to photogrammetry competition. Basic mapping services bill $500-$1,500 per day. LiDAR work commands $1,500-$3,000 daily. The market premium exists because the capability delivers value competitors can't match.
Getting Started
If you're flying DJI M300 or M350, you already have a LiDAR-capable platform. Test the market before buying sensors. Contact potential clients in target industries. Explain LiDAR capabilities. Ask about their current survey methods and costs. You'll discover demand quickly.
For initial testing, consider UgCS Open (free, limited features). Plan sample missions. Learn the software workflow. When you're ready to bid projects, upgrade to UgCS Expert for full LiDAR mission planning capabilities.
Start with one sensor that matches your target market. Construction and surveying? The Zenmuse L2 handles most applications. Forestry work? Mid-range sensors like YellowScan Mapper or Rock Robotic systems perform well. Powerline inspection? Consider sensors optimized for corridor work with higher pulse rates.
Don't wait for perfect conditions or complete knowledge. Clients need LiDAR data now. The operators capturing this work today are building client relationships and reputation that compound over years. Start small, deliver quality work, and grow from there.
With enterprise drone platforms, mid-range LiDAR sensors, and specialized flight planning tools like UgCS, you have everything needed to compete for high-value survey work. The demand exists. The technology is accessible. The market premium is real.Conclusion & Next StepsLiDAR mapping offers a significant competitive advantage for professional drone pilots. It allows you to bid on high-value contracts in forestry, engineering, and utilities that are inaccessible to standard camera drones.
However, the hardware is only half the equation. To deliver survey-grade results, you need rigorous flight planning software that handles the unique demands of LiDAR sensors.LiDAR surveying is an investment. Don't let a $50,000 sensor fail because of a flight planning error.
Your LiDAR sensor is only as good as your flight plan. Eliminate data gaps and ensure consistent point density with the industry-standard tool for professional pilots. Try UgCS Free!
Frequently Asked Questions About LiDAR Drone Mapping
How accurate is LiDAR drone mapping?
UAV LiDAR typically achieves 2-5cm vertical accuracy, with survey-grade systems reaching 1-2cm when using PPK/RTK processing. Accuracy depends on sensor quality, flight parameters, and processing workflow.
Typical accuracy ranges:
Entry-level sensors (Velodyne Puck, YellowScan Mapper): ±5 cm vertical, ±10 cm horizontalMid-range sensors (Zenmuse L1/L2, Rock Robotic R2A): ±3 cm vertical, ±5 cm horizontalSurvey-grade sensors (RIEGL miniVUX, YellowScan Surveyor Ultra): ±1-2 cm vertical, ±2-3 cm horizontal.
These specifications assume:
- RTK or PPK GPS correction
- Proper IMU calibration before and after flight
- Appropriate flight altitude (40-100m AGL for quoted accuracy)
- Good GPS satellite coverage (8+ satellites)
- Proper sensor calibration and boresight alignment
Factors that degrade accuracy:
Poor GPS conditions: Flying in canyons, under power lines, or near tall buildings reduces satellite visibility. Position errors increase to 10-30 cm without RTK correction.Skipped calibration: IMU drift introduces systematic errors. Point clouds appear wavy. Accuracy degrades to 10-20 cm even with good sensors.
Excessive altitude: Sensors have maximum effective range. Operating near this limit reduces accuracy. A sensor rated for 1-2 cm accuracy at 100m might deliver 5-8 cm accuracy at 200m.
Fast flight speed: Rapid motion challenges IMU performance. Flying 15 m/s degrades accuracy compared to 5 m/s, all else equal.
Post-processing quality: Rushed classification and poor noise filtering introduce errors. Spending time on proper processing improves deliverable accuracy significantly.
Improving accuracy: Establish ground control points (GCPs) with survey-grade GPS. Measure GCP coordinates to ±2 cm. Process the point cloud with RTK positions. Then verify against GCPs. Adjust if systematic errors exist. This workflow delivers best possible accuracy for critical applications.
What are the best weather conditions for LiDAR drone surveys?
LiDAR works in conditions that ground photogrammetry. But weather still affects operations.
Optimal conditions:
- Overcast skies (clouds don't affect laser returns)
- Light winds (under 8 m/s)
- Dry air
- Temperatures 10-30°C
You can fly all day without sun angle concerns. No shadows to worry about. Consistent lighting doesn't matter because LiDAR provides its own illumination.Acceptable conditions:
- Partly cloudy
- Winds 8-12 m/s (monitor platform stability)
- Light fog (reduces range by 10-20% but still workable)
- Cold temperatures down to -10°C (battery capacity drops 25-30%, plan accordingly)
Avoid these conditions:Rain: Water droplets scatter laser pulses. Light rain reduces range by 20-30%. Heavy rain cuts range by 40-50% or makes surveying impossible. The sensor still functions, but data quality suffers and effective coverage drops.
Heavy fog: Dense fog blocks laser returns entirely. If you can't see 100m visually, don't fly LiDAR surveys.
High winds: Winds over 15 m/s (33 mph) destabilize the platform. IMU performance degrades. Point cloud quality suffers. The drone may also struggle to maintain planned flight path, creating coverage gaps.
Snow: Falling snow has the same effect as rain. Snow cover on the ground is fine (you're measuring snow surface). Active snowfall blocks laser pulses.
Temperature extremes: Very hot conditions (over 40°C) can affect sensor performance. Check manufacturer specifications. Very cold (below -15°C) causes severe battery capacity loss and may affect sensor operation.
Wind strategy: Launch from sheltered locations. Fly during morning hours when winds are typically calmer. Reduce flight speed in gusty conditions to help the autopilot maintain stable altitude. Increase sidelap from 40% to 50-60% to compensate for wind drift.
Seasonal considerations: Fall and early spring often provide excellent LiDAR conditions in temperate climates. Deciduous trees have dropped leaves (improving ground penetration). Temperatures are moderate. Weather is often overcast. Summer can be good but avoid midday heat. Winter works if you manage battery warming and avoid active precipitation.How much area can be covered in a single LiDAR drone flight?Coverage depends on platform flight time, sensor specifications, altitude, and required point density.Typical coverage examples:DJI M300 with Zenmuse L2:
- Flight time: 35-40 minutes productive survey time per battery
- At 80m altitude, 8 m/s speed, 40% sidelap: 50-70 hectares per battery
- At 60m altitude, 6 m/s speed, 50% sidelap: 25-35 hectares per battery
DJI M350 with mid-range sensor:
- Flight time: 38-43 minutes productive survey time per battery
- Similar coverage to M300 (slightly longer flight time)
Fixed-wing VTOL with LiDAR:
- Flight time: 45-60 minutes productive survey time
- At 120m altitude: 150-250 hectares per flight
- Best for large-area reconnaissance or lower point density requirements
Real-world adjustments:These numbers assume ideal conditions. Reduce coverage estimates by 20-30% for:
- Wind over 10 m/s (burns battery faster)
- Cold temperatures (battery capacity drops)
- Complex terrain with elevation changes (more climbing and descending)
- Multiple calibration patterns (takes time from survey coverage)
Conservative battery management (landing at 30% rather than 25%)Multi-battery operations:Large sites require battery changes. Plan missions with battery swap points. Modern flight planning software resumes missions from the last completed waypoint.
Example: A 200-hectare site at 80m altitude with moderate point density needs 3-4 batteries. Total flight time: 2-3 hours including battery swaps and system checks. Total elapsed time: 4-6 hours including mission planning, setup, and post-flight verification.Corridor surveys:Linear features cover differently. Powerline corridors:
- At 60m altitude, 8 m/s speed: 25-35 km per battery
- At 80m altitude, 10 m/s speed: 35-45 km per battery
Corridor coverage depends on corridor width. A 100m-wide corridor needs 2-3 flight lines. A 200m-wide corridor needs 4-5 lines. This affects total distance covered per battery.Optimizing coverage:Fly higher for maximum area coverage (point density decreases). Fly lower for highest point density (area coverage decreases). Match altitude to project requirements. Don't fly higher than necessary for specified point density.
Use efficient flight planning. Minimize transit time to survey area. Optimize flight line direction to reduce the number of turns. Every turn wastes time and battery capacity.
- LiDAR Drone Mapping in Spain: 36 Archaeological Sites Discovered with UgCS
- Advancements in Archaeological Surveys: Drone-Based Magnetometry at the Roman Fortress of Theilenhofen
- GPR and Magnetometry Drone Surveys Reveal Unexplored Archaeological Features at Remote Mimbres Site
- GPR+drone integrated system for Archaeological investigation of Inca ruins
1. Powerline corridor surveys. Electric utilities need vegetation clearance analysis. Regulations mandate minimum distances between conductors and trees. LiDAR captures both wire geometry and vegetation structure in one flight. Fly the corridor at 60-80m altitude, 5-8 m/s ground speed. Process the point cloud to classify wires, towers, and vegetation. Software measures clearance distances automatically. Output identifies trees requiring trimming with GPS coordinates for ground crews. Utilities bill this per kilometer of corridor or per tower span. Rates vary: $50-$150 per km for basic surveys, up to $300/km for detailed analysis including tower structural assessment.
2. Pipeline right-of-way monitoring. Oil and gas operators monitor pipelines for third-party intrusion, erosion, and ground movement. LiDAR detects unauthorized construction, vegetation encroachment, or terrain changes that threaten buried infrastructure.Repeat surveys (annual or semi-annual) reveal ground subsidence, washouts, or slope instability. Compare point clouds to measure vertical displacement. Operators prioritize inspection of high-risk segments.
3. Railway corridor clearance. Rail operators need structure gauge verification. Signals, platforms, and bridges must maintain clearance envelopes around tracks. LiDAR surveys capture track geometry and adjacent structures. Engineers verify clearances meet standards and identify encroachments.
4. Bridge inspection. Traditional inspections use bucket trucks, scaffolding, or rope access. LiDAR captures bridge underside geometry, pier structure, and approaches without physical access. Point clouds document existing conditions. Repeat surveys track deflection, settlement, or structural deformation.
The value proposition here is simple: drones fly faster and safer than ground crews or helicopters. A helicopter powerline survey costs $2,000-$5,000 per hour. Drone LiDAR runs $500-$1,500 per day and covers comparable distances.
4. Archaeology and Heritage Preservation
Archaeologists use LiDAR to detect features invisible at ground level. Ancient settlements, roads, and field systems leave subtle topographic signatures. Elevation differences of 20-50 cm reveal structures buried under soil or vegetation.
Applications of LiDAR drones in archaeology and heritage preservation:
1. Archaeological site discovery:
LiDAR has rediscovered Maya cities under Central American jungle, medieval villages in European forests, and prehistoric earthworks in North America. The technology strips vegetation digitally, revealing micro-topography that indicates human activity. Research teams fly LiDAR over known archaeological zones. Analysts process the point cloud to generate a bare-earth DEM. Hill-shading and slope analysis highlight linear features (roads, walls) and mounds (building foundations, burial sites).
Examples:
- LiDAR Drone Mapping in Spain: 36 Archaeological Sites Discovered with UgCS
- Advancements in Archaeological Surveys: Drone-Based Magnetometry at the Roman Fortress of Theilenhofen
- GPR and Magnetometry Drone Surveys Reveal Unexplored Archaeological Features at Remote Mimbres Site
- GPR+drone integrated system for Archaeological investigation of Inca ruins
2. Cultural heritage documentation:
Historic buildings, monuments, and landscapes require detailed records for preservation and restoration. LiDAR produces millimeter-accurate 3D models. If structures collapse or suffer damage, architects have precise geometric data for reconstruction.
Combined RGB and LiDAR surveys deliver both geometry and texture. The point cloud provides measurements. Photos supply visual detail. Together, they create complete digital archives.
Examples:
- How Ileron Transformed DJI Drones into Precision Aerial Survey Tools with UgCS Flight Planning Software
- Korea Heritage University: 61% Faster Hyperspectral Imaging Through Integrated Gimbal and Flight Control System
- GPR and Magnetometry Drone Surveys Reveal Unexplored Archaeological Features at Remote Mimbres Site
3. Landscape analysis:
LiDAR reveals historical land use patterns. Old field boundaries, drainage systems, and terraces show up in the bare-earth DEM. Historians use this data to understand past agricultural practices and settlement patterns.
The penetration capability matters in archaeological surveys just as in forestry. Ancient sites are often covered by vegetation. LiDAR penetrates forest canopy to reveal ground features that would otherwise require ground-clearing for traditional survey methods.
How to Plan a Perfect LiDAR Drone Survey
LiDAR drone survey missions require more preparation than standard photogrammetry flights. You're maintaining precise altitude over changing terrain while ensuring proper sensor calibration. Here's how to execute clean surveys that deliver usable data.
Step 1: Define Survey Parameters
Start with your deliverable requirements. What does the client need?
Point density: Construction surveys need 50-100 points/m². Forestry applications work with 10-20 points/m². Powerline inspections require 100-200 points/m². Infrastructure detail work demands 300+ points/m².
Accuracy requirements: Topographic surveys typically specify ±5 cm vertical accuracy. Engineering surveys might require ±2-3 cm. Check your sensor specifications. Entry-level sensors deliver ±5 cm. Survey-grade systems reach ±1-2 cm with proper calibration and RTK correction.
Coverage area: Measure the survey zone. A 50-hectare site at 80m altitude with 60% sidelap needs roughly 8-10 flight lines. Calculate battery requirements. Each battery provides 30-35 minutes of productive flight time.
Terrain complexity: Flat sites are straightforward. Rolling terrain needs terrain-following automation. Steep slopes or cliffs require careful altitude management to maintain safe clearance while keeping point density consistent.
Step 2: Select Flight Parameters
Your sensor specifications drive flight planning calculations.
- Altitude above ground: Most LiDAR surveys fly 50-100m AGL. Higher altitude covers more area per flight but reduces point density. Lower altitude increases density but requires more flight lines and battery changes.
- Calculate coverage width using your sensor's field of view. A 70° FOV at 80m altitude covers roughly 100m width. A 105° FOV covers 145m at the same altitude.
- Flight speed: Faster flight reduces survey time but lowers point density. Typical speeds: 5-8 m/s for detailed surveys, 8-12 m/s for reconnaissance work.
- Point density calculation: (Pulse rate × FOV coverage) ÷ (Flight speed × Line spacing). A sensor firing 300,000 pulses/second at 80m altitude (100m swath) flying 8 m/s with 60m line spacing produces approximately 62 points/m².
NOTE: This is a simplified estimation. Actual density varies based on scanner mirror speed and overlap settings. Always verify in UgCS during planning.
- Line spacing and overlap: Standard practice uses 30-50% sidelap. This ensures coverage gaps don't occur and provides overlap for accuracy verification. A 100m swath width with 40% overlap means 60m line spacing.
- Flight direction: Fly perpendicular to terrain slope when possible. This maintains a more consistent AGL than flying up and down slopes. For corridor surveys, fly parallel to the feature (powerline, pipeline, road).
Real-world example: A powerline survey flown with 20% overlap in 10 m/s winds experienced 5-8m lateral drift. Several sections had no coverage. The operator re-flew 40% of the corridor. Using 40% overlap initially would have saved time and client frustration.
Step 3: Prepare Terrain Data
Accurate terrain following requires quality elevation data.
Elevation data sources: Default datasets like SRTM (30m resolution) or ASTER (30m resolution) work for gentle terrain. For complex topography, use higher resolution data:
- USGS 3DEP (1-10m resolution, USA)
- Copernicus DEM (10-30m resolution, global)
- Local lidar datasets from previous surveys
- Photogrammetry-derived DEMs from preliminary flights
Import terrain data into your flight planning software. Preview the elevation profile along your planned flight lines. Look for sudden elevation changes that might create clearance issues or excessive altitude variations.
Terrain following settings: Set your desired AGL height. Software calculates the 3D flight path automatically. For survey work, maintain constant AGL (±5m variation). This keeps point density consistent across the survey area.
Add altitude buffers for obstacles. If the terrain has towers, trees, or structures, add 20-30m clearance to your base AGL setting in those zones.
Step 4: Plan IMU Calibration Patterns
LiDAR sensors contain Inertial Measurement Units (IMUs) that track sensor orientation. IMU drift over time introduces errors in point cloud geometry. Calibration flights correct this drift.
When to calibrate:
- Before starting the survey (always)
- After battery changes on long missions
- Every 20-30 minutes of flight time for highest accuracy
- After the survey (recommended for professional work)
Calibration patterns: Figure-8 patterns work for most sensors. Fly two overlapping circles. This exposes the IMU to varied orientations and helps the sensor's processing software calculate correction parameters.
Some sensors specify calibration box patterns (fly a rectangular pattern with turns). Check your sensor documentation for recommended procedures.
Flight planning software should automate this. Insert calibration actions at mission start. The drone flies the pattern, then proceeds to survey lines.
Step 5: Build the Flight Plan
Use desktop flight planning software for anything beyond simple area scans.
For area surveys:
- Draw the survey boundary polygon on the map
- Enter desired point density or manually set altitude, speed, and line spacing
- Set flight direction (perpendicular to terrain slope or prevailing wind)
- Enable terrain following and load elevation data
- Add IMU calibration patterns at start and end
- Set camera actions if your sensor includes RGB capability
- Review the 3D flight path for altitude conflicts or coverage gaps
For corridor surveys:
- Import the corridor centerline (KML, CSV, or draw manually)
- Set corridor width (typically 50-200m depending on feature)
- Configure flight parameters (altitude, speed, line spacing)
- Enable terrain following
- Add calibration patterns
- Split the mission at battery change points if needed
Mission validation: Preview the elevation profile. Look for sections where AGL varies significantly. Adjust altitude settings if terrain changes force large variations. Check total flight time against battery capacity. Add 20% buffer for wind, temperature effects, and reserve.
Export the mission to your controller or field tablet.
Step 6: Pre-Flight Checks
Field preparation prevents mission failures.
Equipment checks:
- Verify drone battery charge (all batteries)
- Check LiDAR sensor battery level (if separate from drone power)
- Confirm RTK base station setup or NTRIP connection
- Test controller-to-drone communication
- Verify SD card capacity for data storage
- Check propeller condition and mounting
Environmental assessment:
- Wind speed at altitude (limit: 10-12 m/s for most platforms)
- Visibility for visual line of sight requirements
- Airspace authorization if required
Obstacle identification near flight path
Mission rehearsal: Load the flight plan. Review the path on the controller. Verify takeoff and landing points are clear. Confirm altitude settings make sense for visible terrain.
Step 7: Execute the Mission
Launch and monitor the automated flight.
Takeoff: Most software starts missions from takeoff point. The drone climbs to mission altitude, flies to the first waypoint, executes calibration pattern, then begins survey lines.
Monitoring: Watch AGL height during flight. Verify the sensor is recording (check LED indicators or telemetry). Monitor battery level. Most platforms trigger return-to-home automatically at 25-30% battery.
Battery changes: For multi-battery missions, land when prompted. Swap battery. Relaunch. The software resumes from the last completed segment or waypoint.
Data verification: After landing, check that data files are recorded properly. LiDAR sensors save point cloud data to onboard storage. Verify file sizes are reasonable for flight duration. Don't delete anything until you've processed and validated the data.
Step 8: Post-Flight Calibration (Optional but Recommended)
Fly another calibration pattern after completing survey lines. This helps sensor processing software refine IMU corrections. The difference between pre-flight and post-flight calibration data reveals IMU drift during the mission.
Some processing workflows require both calibrations. Check your sensor manufacturer's recommendations.
Advanced Tips for UAV LiDAR Mapping Success
LiDAR missions succeed or fail based on planning details most operators overlook. Here's what separates clean, usable data from expensive re-flights.
Technical Optimization
Optimal Flying Height
Balance coverage efficiency against point density requirements. Most commercial work operates at 40-80m AGL.
40-60m altitude: Delivers 150-300 points/m² with typical sensors (300,000-600,000 pulse rate). Use this height for detailed infrastructure inspections, dam surveys, or archaeology work where you need to detect small features.
60-80m altitude: Produces 75-150 points/m². Suitable for topographic surveys, forestry applications, and powerline corridor mapping. Covers more ground per flight. Most survey work happens in this range.
80-120m altitude: Yields 30-75 points/m². Acceptable for reconnaissance surveys, preliminary site assessment, or applications where relative measurements matter more than absolute detail. Maximizes area coverage per battery.
Higher altitude reduces flight time but remember: point density drops with the square of altitude. Double your height, and density falls to 25% of original values. A sensor producing 200 points/m² at 50m drops to 50 points/m² at 100m.
Speed Considerations
Flight speed directly affects point density along the flight direction.
Slow (3-5 m/s): Increases point density and improves feature detection. Use slower speeds for corridor surveys where you need to capture small objects (powerline hardware, pipeline markers). Also beneficial in steep terrain where terrain-following system needs response time.
Medium (5-8 m/s): Standard for most survey work. Good balance between coverage efficiency and data quality. Most professional operators fly in this range.
Fast (8-12 m/s): Reduces point density but covers large areas quickly. Acceptable for reconnaissance work or projects where point density requirements are modest (20-50 points/m²).
Calculate actual point density before flying. A sensor firing 300,000 pulses per second flying 5 m/s with 60m line spacing produces a different density than the same sensor at 10 m/s. Software should calculate this automatically based on your flight parameters.
Weather Impact
LiDAR performs better than photogrammetry in overcast conditions, but weather still affects operations.
Optimal conditions: Overcast skies, light wind (under 8 m/s), dry air. Clouds don't affect laser returns. You can fly all day without worrying about sun angle or shadows.
Acceptable conditions: Partly cloudy, winds 8-12 m/s. Monitor altitude-hold performance. Stronger winds reduce battery life by 15-25%.
Avoid: Rain, fog, snow, winds over 15 m/s. Water droplets scatter laser pulses and reduce effective range. Heavy rain can cut the maximum range by 30-40%. Fog blocks returns entirely.
High winds destabilize the platform and degrade IMU performance.
Temperature affects range slightly. Cold air is denser, increasing range by 2-3%. Hot air decreases it proportionally. This matters for sensors operating near maximum range specifications.
Battery Management
Cold temperatures significantly reduce flight time. LiPo batteries lose 20-30% capacity below 10°C and 40-50% capacity below 0°C.
Cold weather protocol:
- Store batteries at room temperature until field deployment
- Use battery warming bags or keep batteries inside your vehicle heater
- Warm batteries to 20-25°C before installation
- Launch immediately after installing warm batteries
- Expect 25-30% shorter flight times in freezing conditions despite warming
Plan battery counts accordingly. A site requiring 4 batteries in summer might need 6 batteries in winter. Keep spares warm in a heated vehicle between flights.
RTK and Positioning Accuracy
LiDAR accuracy depends on positioning quality. Most enterprise drones include RTK (Real-Time Kinematic) GNSS receivers.
RTK setup options:
NTRIP correction: Connect to internet-based correction networks. Requires cellular coverage. Accuracy: 1-2 cm horizontal, 2-3 cm vertical.
Base station: Set up your own RTK base at a known point. Works in areas without cellular coverage. Accuracy: 1-2 cm horizontal, 2-3 cm vertical. Requires base receiver equipment (additional $3,000-$8,000 investment).
PPK (Post-Processed Kinematic): Process positioning data after flight using base station logs. Same accuracy as RTK but doesn't require radio link during flight. Adds processing steps but works in challenging RF environments.
For highest accuracy, establish Ground Control Points (GCPs) and use them to verify point cloud accuracy. Even with RTK, GCPs improve confidence in deliverables for critical applications.
Common Mistakes to Avoid
Insufficient Calibration
Skipping proper IMU calibration leads to wavy or distorted point clouds. The sensor's internal gyroscopes and accelerometers drift during flight. Calibration patterns expose the IMU to varied orientations so processing software can calculate correction factors.
Symptoms of poor calibration:
- Point clouds appear wavy or rippled
- Buildings lean or appear twisted
- Ground surfaces show systematic undulation
- Vertical features (walls, trees) appear tilted
Fix: Always calibrate before survey flights. For missions longer than 30 minutes, add mid-flight calibration patterns. Fly post-flight calibration for professional deliverables. Some sensor manufacturers' processing software requires both pre and post calibrations for optimal results.
Inadequate Overlap
Using less than 30% overlap between flight lines creates gaps in UAV LiDAR data. Wind drift, GPS errors, or terrain variations push the actual flight path away from planned routes. Insufficient overlap means these deviations create data gaps.
Fix: Use 40% overlap as standard practice. Increase to 50-60% in windy conditions or challenging terrain. The time investment is small compared to re-flight costs.
Ignoring Ground Control
While LiDAR with RTK delivers excellent absolute accuracy, GCPs still improve confidence for critical applications. Engineering surveys, cadastral work, and projects requiring third-party verification benefit from GCP validation.
GCP placement: Distribute 4-6 points around survey perimeter and 1-2 interior points for sites under 50 hectares. Larger sites need proportionally more GCPs.
Target accuracy: survey-grade GPS (±2 cm) for professional deliverables.
GCP use: Process the point cloud with RTK positions. Then measure GCP coordinates in the point cloud. Compare to field-measured positions. Discrepancies reveal systematic errors. Many processing packages allow point cloud adjustment using GCPs as control.
Rushing Post-Processing
Taking time to properly classify points and filter noise dramatically improves deliverable quality. Raw LiDAR point clouds contain noise from birds, insects, atmospheric returns, and multipath errors.
Processing workflow:
- Import and verify: Load raw point cloud. Check coverage, point density, and verify no data gaps exist.
- Noise filtering: Remove outliers (points far above or below local surface). Most software provides automatic noise filters. Inspect results and manually remove remaining obvious errors.
- Ground classification: Separate ground returns from vegetation, buildings, and other features. This is critical for bare-earth DEM generation. Automated classification works on gentle terrain. Complex sites need manual verification and editing.
- Feature extraction: Classify buildings, vegetation, powerlines, or other features relevant to project deliverables. Quality classification makes data useful for clients.
- Accuracy verification: If you established GCPs, measure them in the point cloud. Calculate RMS error. Professional deliverables should include accuracy statements
- Deliverable generation: Export classified point clouds, DEMs, contour maps, or other products per client specifications.
Allocate processing time appropriately. A 50-hectare survey with 100 points/m² takes 4-8 hours to process properly, including classification review and editing. Rushing through classification in 1-2 hours produces inferior deliverables.
Poor File Management
LiDAR projects generate large datasets. A single flight creates 2-10 GB of raw sensor data. Multi-flight projects with RGB imagery included can exceed 50-100 GB.
File management protocol:
- Copy raw data from sensor to computer immediately after landing
- Verify file integrity before deleting sensor storage
- Maintain organized folder structure (Client/Project/Date/Flight)
- Keep raw data archived even after processing
- Back up to separate physical drives or cloud storage
Lost data means complete re-flight. Invest in proper storage and backup systems.
Ignoring Manufacturer Processing Requirements
Different LiDAR sensors have specific processing workflows. Some require proprietary software for initial processing before exporting to standard formats. Others work directly with third-party tools.
Read your sensor manual's processing section. Using incorrect processing workflows degrades accuracy or introduces artifacts. Manufacturer software often includes calibration refinement tools that improve results significantly.
Flying Too High for Project Requirements
Altitude seems like free efficiency, but point density constraints determine usable maximum altitude.
Example: A client requests 100 points/m² for a construction survey. Your sensor fires 300,000 pulses per second with 70° FOV. At 80m altitude with standard flight parameters, you deliver 75 points/m². The deliverable fails client specifications.
Fix: Calculate required altitude before planning missions. Work backward from point density requirements. Verify your planned parameters deliver the specified density. Software should calculate this automatically, but verify the math yourself.
Not Testing Processing Workflow
Process a small test section before committing to large projects. Verify your processing software handles your sensor's data format. Confirm classification tools work on your terrain type. Test deliverable export formats match client requirements.
A test flight over 5-10 hectares reveals workflow issues before you fly 500 hectares and discover problems during processing.
Why LiDAR Mapping Is the Future for Drone Pilots
The commercial drone industry is splitting into two tiers. Basic aerial photography and simple mapping compete on price. Operators undercut each other for commodity work. LiDAR sits in a different market entirely.
Clients hiring LiDAR services need data that cameras can't capture. They have budgets that reflect this requirement. Mining operations pay $1,500-$3,000 per day for stockpile surveys. Utilities budget $100-$300 per kilometer for powerline corridor mapping. Engineering firms bill $150-$400 per hectare for topographic surveys with LiDAR data.
The work exists because ground-based alternatives cost more and take longer. Traditional land surveying costs $2,000-$5,000 per day for a two-person crew with limited coverage. Helicopter LiDAR runs $3,000-$8,000 per hour. Drones deliver comparable data quality at a fraction of the cost.
Market Growth Drivers
Several industries are increasing LiDAR adoption rapidly:
Renewable energy expansion. Solar and wind projects need terrain surveys before construction. Developers assess hundreds of potential sites. LiDAR provides fast, accurate elevation data for engineering analysis. A single wind farm site survey generates $5,000-$15,000 in revenue for 2-3 days of field work.
Infrastructure aging. The US has 617,000 bridges, many built 50-70 years ago. Transportation agencies need condition assessments. Traditional inspection methods require lane closures, scaffolding, or rope access. LiDAR surveys capture structure geometry safely from the air. State DOTs are allocating budgets specifically for drone-based infrastructure assessment.
Mining modernization. Mining operations measure stockpiles weekly or monthly for inventory control. Ground surveys with total stations take days and expose personnel to haul truck traffic. LiDAR operators fly the same sites in hours with zero ground personnel exposure. Mines pay monthly retainers for this service.
Forestry and carbon markets. Carbon credit programs need biomass measurements for verification. LiDAR provides wall-to-wall coverage of forest stands. Traditional plot sampling covers 2-5% of the area. LiDAR scans 100%. Forestry consultants and carbon project developers are major clients for this application.
Regulatory push for better data. Environmental regulations increasingly require detailed terrain and vegetation data. Wetland delineation, floodplain mapping, and habitat assessment all benefit from LiDAR's ability to map ground surface under vegetation. Environmental consulting firms are adopting LiDAR for these applications.
Technology Accessibility
LiDAR barriers to entry have dropped significantly. Five years ago, professional LiDAR sensors cost $100,000-$200,000. Today, capable systems start at $25,000. DJI's Zenmuse L1 and L2 brought survey-grade LiDAR to the M300/M350 platform at prices small operators can justify.
Processing software has also improved. Cloud-based tools like DJI Terra simplify workflows. Desktop applications like QGIS (free) and CloudCompare (free) handle basic classification and analysis. You don't need $10,000 software licenses to deliver professional results.
Flight planning automation makes complex missions manageable. Software like UgCS handles terrain following, calibration patterns, and multi-battery missions automatically. What required expert pilots five years ago is now accessible to operators with standard commercial drone experience.
Building a LiDAR Service Business
Successful LiDAR operators focus on specific verticals. Don't market generic "drone LiDAR services." Target industries with clear needs:
For construction and surveying: Partner with engineering firms and general contractors. Offer volume tracking, progress monitoring, and as-built documentation. Build relationships with 3-5 regular clients who need monthly or quarterly surveys.
For utilities: Approach electric cooperatives and transmission companies. Powerline corridor mapping generates recurring revenue. Once you've surveyed a utility's network, they return annually or bi-annually for vegetation management updates.
For forestry: Contact timber companies, conservation organizations, and carbon project developers. Forest inventory and biomass assessment work comes in large blocks (500-5,000 hectares). Single projects generate $15,000-$50,000 in revenue.
For mining and aggregates: Stockpile measurement is steady, predictable work. Quarries and mines need weekly or monthly surveys. A single site generates $1,200-$2,000 monthly. Sign up 3-4 sites and you have baseline recurring revenue.
The key differentiation? You can deliver data these clients need that photogrammetry operators can't provide. Market this capability directly. Show point cloud samples from under forest canopy. Demonstrate bare-earth DEMs from vegetated sites. Present before/after volume calculations from stockpile surveys.
Investment and ROI
A professional LiDAR setup requires capital investment:
- Enterprise drone platform: $10,000-$15,000 (M300/M350)
- LiDAR sensor: $25,000-$40,000 (Zenmuse L2, mid-range alternatives)
- Flight planning software: $0-$3,000 annually (UgCS tiers)
- Processing software: $0-$5,000 (depends on applications)
- Additional batteries and accessories: $2,000-$4,000
Total investment: $40,000-$65,000 for a capable system.
Revenue potential justifies this investment quickly. A utility corridor survey generates $8,000-$15,000 for 3-5 days of work (planning, flying, processing). A mining client paying $1,500 monthly generates $18,000 annually. Three to four regular clients cover your equipment investment in the first year.
Compare this to photogrammetry competition. Basic mapping services bill $500-$1,500 per day. LiDAR work commands $1,500-$3,000 daily. The market premium exists because the capability delivers value competitors can't match.
Getting Started
If you're flying DJI M300 or M350, you already have a LiDAR-capable platform. Test the market before buying sensors. Contact potential clients in target industries. Explain LiDAR capabilities. Ask about their current survey methods and costs. You'll discover demand quickly.
For initial testing, consider UgCS Open (free, limited features). Plan sample missions. Learn the software workflow. When you're ready to bid projects, upgrade to UgCS Expert for full LiDAR mission planning capabilities.
Start with one sensor that matches your target market. Construction and surveying? The Zenmuse L2 handles most applications. Forestry work? Mid-range sensors like YellowScan Mapper or Rock Robotic systems perform well. Powerline inspection? Consider sensors optimized for corridor work with higher pulse rates.
Don't wait for perfect conditions or complete knowledge. Clients need LiDAR data now. The operators capturing this work today are building client relationships and reputation that compound over years. Start small, deliver quality work, and grow from there.
With enterprise drone platforms, mid-range LiDAR sensors, and specialized flight planning tools like UgCS, you have everything needed to compete for high-value survey work. The demand exists. The technology is accessible. The market premium is real.
Conclusion & Next Steps
LiDAR mapping offers a significant competitive advantage for professional drone pilots. It allows you to bid on high-value contracts in forestry, engineering, and utilities that are inaccessible to standard camera drones.
However, the hardware is only half the equation. To deliver survey-grade results, you need rigorous flight planning software that handles the unique demands of LiDAR sensors.
LiDAR surveying is an investment. Don't let a $50,000 sensor fail because of a flight planning error.
Your LiDAR sensor is only as good as your flight plan. Eliminate data gaps and ensure consistent point density with the industry-standard tool for professional pilots.
Frequently Asked Questions About LiDAR Drone Mapping
How accurate is LiDAR drone mapping?
UAV LiDAR typically achieves 2-5cm vertical accuracy, with survey-grade systems reaching 1-2cm when using PPK/RTK processing. Accuracy depends on sensor quality, flight parameters, and processing workflow.
Typical accuracy ranges:
Entry-level sensors (Velodyne Puck, YellowScan Mapper): ±5 cm vertical, ±10 cm horizontal
Mid-range sensors (Zenmuse L1/L2, Rock Robotic R2A): ±3 cm vertical, ±5 cm horizontal
Survey-grade sensors (RIEGL miniVUX, YellowScan Surveyor Ultra): ±1-2 cm vertical, ±2-3 cm horizontal.
These specifications assume:
- RTK or PPK GPS correction
- Proper IMU calibration before and after flight
- Appropriate flight altitude (40-100m AGL for quoted accuracy)
- Good GPS satellite coverage (8+ satellites)
- Proper sensor calibration and boresight alignment
Factors that degrade accuracy:
Poor GPS conditions: Flying in canyons, under power lines, or near tall buildings reduces satellite visibility. Position errors increase to 10-30 cm without RTK correction.
Skipped calibration: IMU drift introduces systematic errors. Point clouds appear wavy. Accuracy degrades to 10-20 cm even with good sensors.
Excessive altitude: Sensors have maximum effective range. Operating near this limit reduces accuracy. A sensor rated for 1-2 cm accuracy at 100m might deliver 5-8 cm accuracy at 200m.
Fast flight speed: Rapid motion challenges IMU performance. Flying 15 m/s degrades accuracy compared to 5 m/s, all else equal.
Post-processing quality: Rushed classification and poor noise filtering introduce errors. Spending time on proper processing improves deliverable accuracy significantly.
Improving accuracy: Establish ground control points (GCPs) with survey-grade GPS. Measure GCP coordinates to ±2 cm. Process the point cloud with RTK positions. Then verify against GCPs. Adjust if systematic errors exist. This workflow delivers best possible accuracy for critical applications.
What are the best weather conditions for LiDAR drone surveys?
LiDAR works in conditions that ground photogrammetry. But weather still affects operations.
Optimal conditions:
- Overcast skies (clouds don't affect laser returns)
- Light winds (under 8 m/s)
- Dry air
- Temperatures 10-30°C
You can fly all day without sun angle concerns. No shadows to worry about. Consistent lighting doesn't matter because LiDAR provides its own illumination.
Acceptable conditions:
- Partly cloudy
- Winds 8-12 m/s (monitor platform stability)
- Light fog (reduces range by 10-20% but still workable)
- Cold temperatures down to -10°C (battery capacity drops 25-30%, plan accordingly)
Avoid these conditions:
Rain: Water droplets scatter laser pulses. Light rain reduces range by 20-30%. Heavy rain cuts range by 40-50% or makes surveying impossible. The sensor still functions, but data quality suffers and effective coverage drops.
Heavy fog: Dense fog blocks laser returns entirely. If you can't see 100m visually, don't fly LiDAR surveys.
High winds: Winds over 15 m/s (33 mph) destabilize the platform. IMU performance degrades. Point cloud quality suffers. The drone may also struggle to maintain planned flight path, creating coverage gaps.
Snow: Falling snow has the same effect as rain. Snow cover on the ground is fine (you're measuring snow surface). Active snowfall blocks laser pulses.
Temperature extremes: Very hot conditions (over 40°C) can affect sensor performance. Check manufacturer specifications. Very cold (below -15°C) causes severe battery capacity loss and may affect sensor operation.
Wind strategy: Launch from sheltered locations. Fly during morning hours when winds are typically calmer. Reduce flight speed in gusty conditions to help the autopilot maintain stable altitude. Increase sidelap from 40% to 50-60% to compensate for wind drift.
Seasonal considerations: Fall and early spring often provide excellent LiDAR conditions in temperate climates. Deciduous trees have dropped leaves (improving ground penetration). Temperatures are moderate. Weather is often overcast. Summer can be good but avoid midday heat. Winter works if you manage battery warming and avoid active precipitation.
How much area can be covered in a single LiDAR drone flight?
Coverage depends on platform flight time, sensor specifications, altitude, and required point density.
Typical coverage examples:
DJI M300 with Zenmuse L2:
- Flight time: 35-40 minutes productive survey time per battery
- At 80m altitude, 8 m/s speed, 40% sidelap: 50-70 hectares per battery
- At 60m altitude, 6 m/s speed, 50% sidelap: 25-35 hectares per battery
DJI M350 with mid-range sensor:
- Flight time: 38-43 minutes productive survey time per battery
- Similar coverage to M300 (slightly longer flight time)
Fixed-wing VTOL with LiDAR:
- Flight time: 45-60 minutes productive survey time
- At 120m altitude: 150-250 hectares per flight
- Best for large-area reconnaissance or lower point density requirements
Real-world adjustments:
These numbers assume ideal conditions. Reduce coverage estimates by 20-30% for:
- Wind over 10 m/s (burns battery faster)
- Cold temperatures (battery capacity drops)
- Complex terrain with elevation changes (more climbing and descending)
- Multiple calibration patterns (takes time from survey coverage)
Conservative battery management (landing at 30% rather than 25%)
Multi-battery operations:
Large sites require battery changes. Plan missions with battery swap points. Modern flight planning software resumes missions from the last completed waypoint.
Example: A 200-hectare site at 80m altitude with moderate point density needs 3-4 batteries. Total flight time: 2-3 hours including battery swaps and system checks. Total elapsed time: 4-6 hours including mission planning, setup, and post-flight verification.
Corridor surveys:
Linear features cover differently. Powerline corridors:
- At 60m altitude, 8 m/s speed: 25-35 km per battery
- At 80m altitude, 10 m/s speed: 35-45 km per battery
Corridor coverage depends on corridor width. A 100m-wide corridor needs 2-3 flight lines. A 200m-wide corridor needs 4-5 lines. This affects total distance covered per battery.
Optimizing coverage:
Fly higher for maximum area coverage (point density decreases). Fly lower for highest point density (area coverage decreases). Match altitude to project requirements. Don't fly higher than necessary for specified point density.
Use efficient flight planning. Minimize transit time to survey area. Optimize flight line direction to reduce the number of turns. Every turn wastes time and battery capacity.