

So, what's the significance of measuring wind via drones? The rationale lies in the limitations of stationary sensors. They are not omnipresent, and, at times, their reliability is questionable. Here are some technical observations our R&D team made:
- Existing anemometers on wind turbines are typically located behind the blades. This position can lead to airflow perturbations caused by the turbine itself.
- It's essential to factor in PPM concentrations and wind parameters to comprehensively understand methane leaks. However, critical locations such as landfills and pipelines frequently lack the necessary wind measurement instruments.
- Hyperlocal meteorology has a wide range of applications that benefit from 3D wind measurements.
Now, let's dig into technology and observations.
Data acquisition
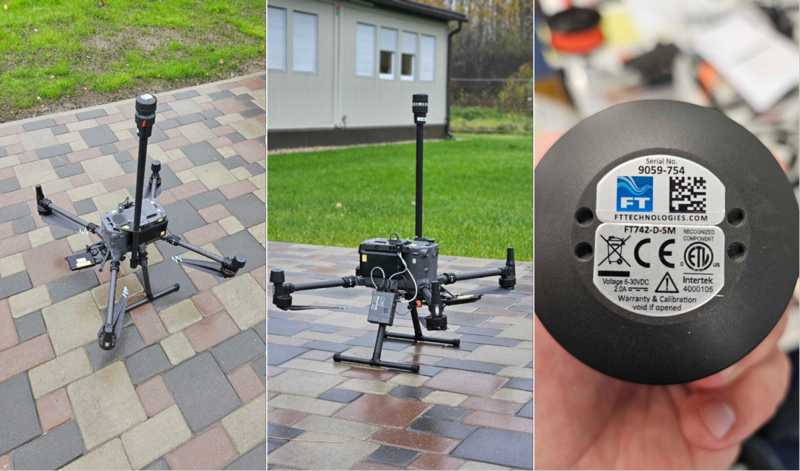
Hardware setup consists of the following components:
- DJI M300 as a flying platform
- FT-742-D-SM sensor provided by FT Technologies Ltd
- SkyHub with specially designed mast (50cm) by SPH Engineering
We structured data collection into two stages:
- Collecting wind data from a moving platform, simulating tasks like area scanning or methane leak detection surveys.
- Gathering data while the drone is hovering to emulate a wind turbine energy generation assessment survey.
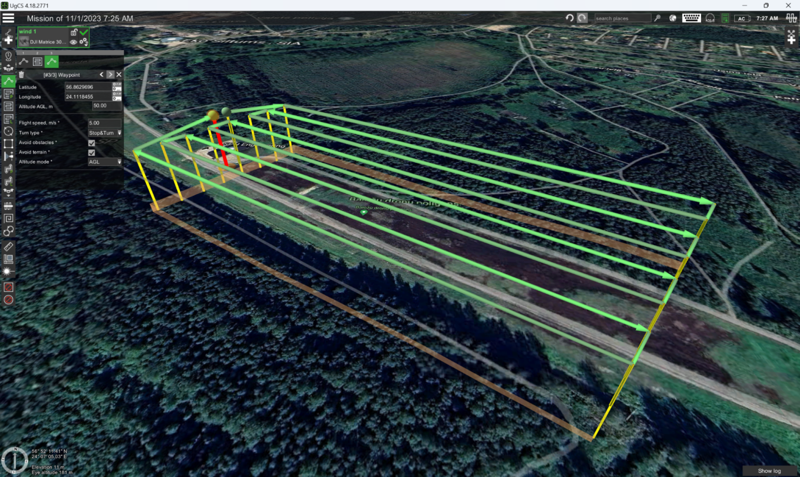
The area scan was configured using the UgCS software, which provides user-friendly tools for designing a consistent pattern with fixed line spacing and flight altitude. The selected flight altitude was set at 50 meters AGL.
For the second phase of the experiment, the sensor was manually positioned at five distinct altitudes: 10, 20, 30, 40, and 50 meters AGL, with data collection at each altitude lasting 2 minutes.
We conducted two flights within one hour in the morning from 9:30 to 10:30 (GMT+2). Thus, in total, we had six series of data: one for area scan patterns and five for hovering at different altitudes.
Throughout the flight, the SkyHub onboard computer recorded the sensor's data.
Data analysis
After the flight data from FT-742-D-SM were extracted from SkyHub and analyzed, SkyHub makes an onboard georeferencing of the sensor data and logs sensor readings into a convenient CSV file. In the case of wind measurement file consists of the following columns (see example):
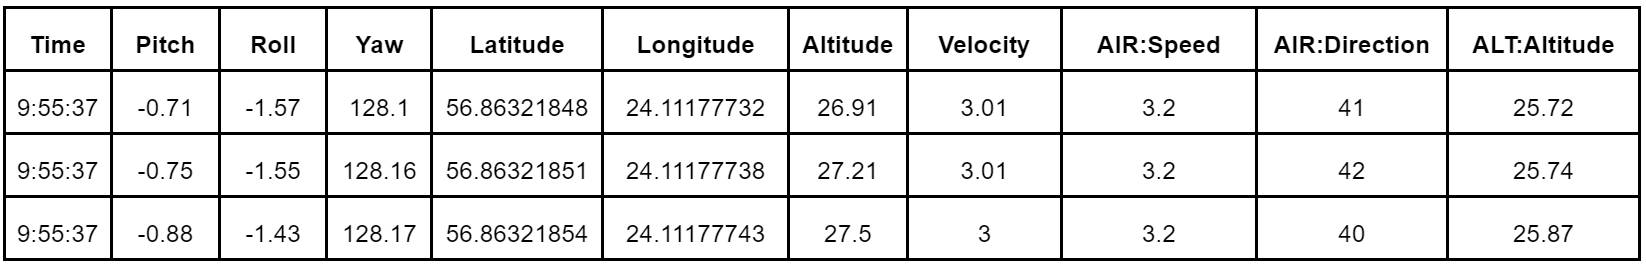
AIR: Speed and AIR: Direction columns contain wind sensor readings.
SkyHub data can be analyzed in different GIS software packages. In our particular case, we used DroneGIS (by SPH Engineering).
During the data analysis, we wanted to validate data using the following methods:
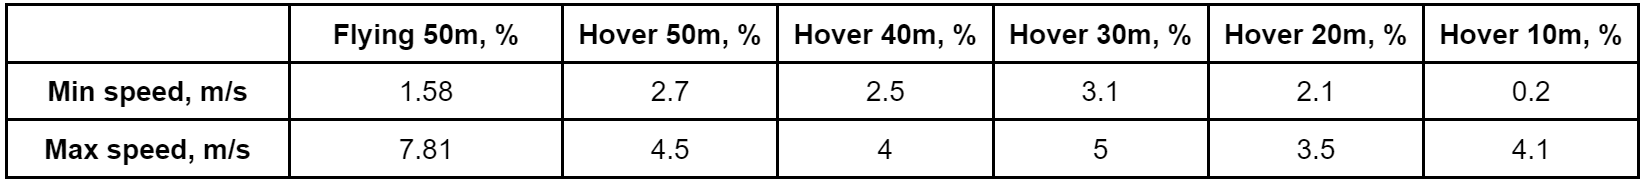
- Wind speed maximum and minimum values analysis for making a common sense check and comparing to other observations
- Generating and comparing probability distributions of wind speed
- Generating and comparing wind-roses
Data was preprocessed according to the standard procedure:
- clipping take-off, landing locations, and turns
- noise-filtering using a sliding window approach with a median filter
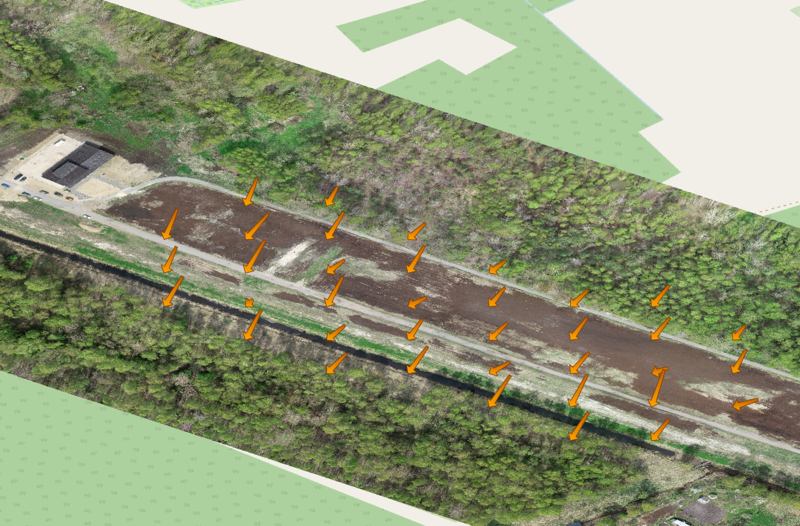
For data collected on a moving platform for every trajectory point, we calculated True Wind Speed and True Wind Direction by combining the moving platform's speed vectors and the sensor's wind vector. We also applied a gridding algorithm to get a better distribution of wind measurements over the area—the visualization of the true wind vector is presented in the image below.
Then, we started data validation.
First, we compared maximum and minimum values, and the data appeared to be mostly in the same range.
Then we made a probability distribution of speeds over 5 bins: 0-2 m/s, 2-4 m/s, 4-6 m/s. 6-8 m/s, 8-10 m/s.
The same data can be found on the chart below
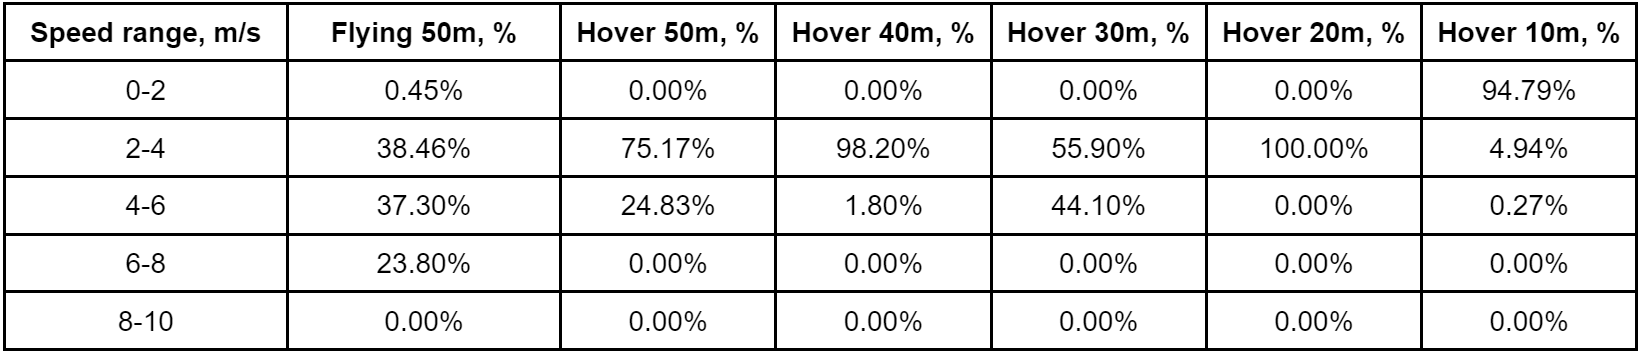
We saw that most of the data is in the 2-6 m/s range, which makes sense for the area and time of the day.
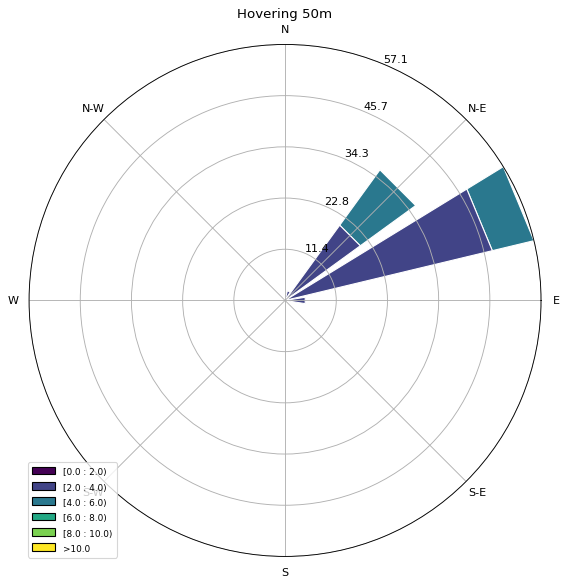
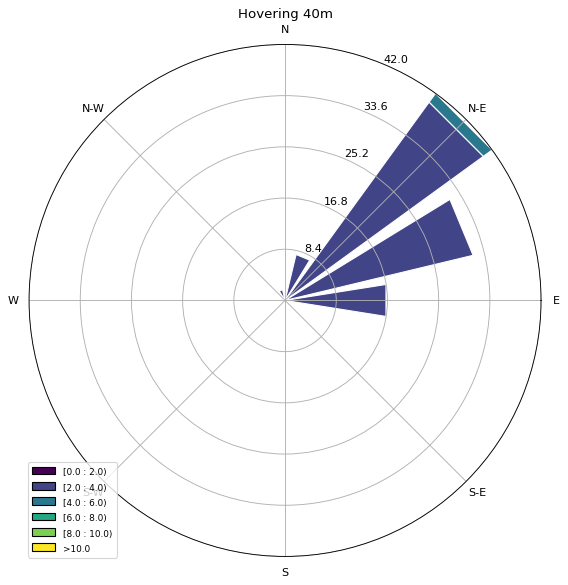
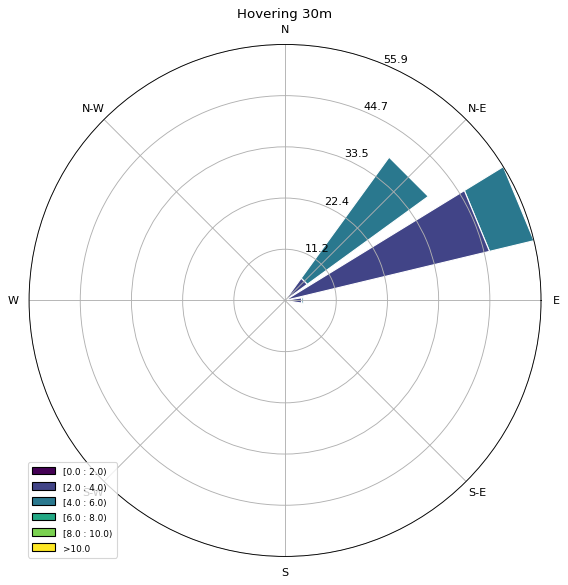
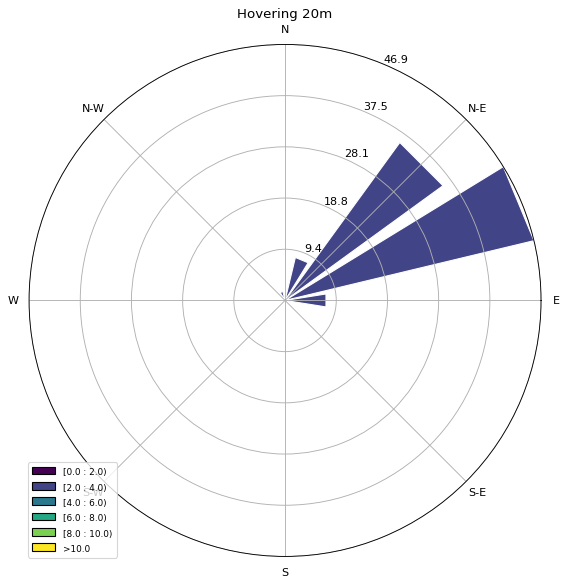
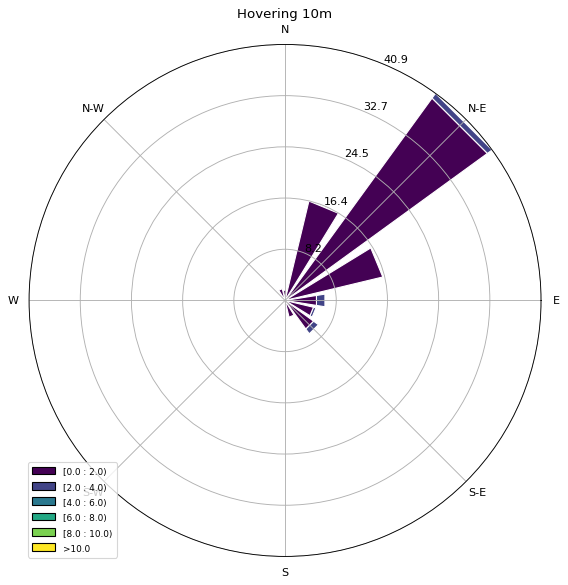
The most interesting part was to build wind-rose for all six types of measurements.
Here are a few hints for those unfamiliar with wind rose diagram interpretation.
A wind rose is a graphic tool that displays how wind speed and direction are typically distributed at a particular location. It provides a compact view of the frequency of winds coming from each directional sector and their intensity. Here's a brief overview of how to interpret it:
Direction: The wind rose is divided into sectors, typically representing the cardinal directions (N, NE, E, SE, S, SW, W, NW). The direction shown indicates where the wind is coming from. For example, if you see data in the "N" sector, the wind blows from the North to the South.
Length of the Bars: The bars or petals extending from the circle's center to the outer edge indicate the frequency with which winds blow from that direction. A longer bar in a specific sector means wind from that direction occurs more frequently.
Color Coding: The colors of the bars or petals represent wind speed ranges. Lighter shades typically indicate slower wind speeds, while darker shades indicate faster wind speeds.
Percentages: The percentages associated with each colored section of the bars represent the time the wind blows from that direction and within that speed range. For instance, if you see a bar in the "N" sector colored blue at 10% and red at 5%, it means that the wind blows from the North at the speed range represented by blue 10% of the time and at the speed range represented by red 5% of the time.
Which percentages form 100%: All the percentages across all sectors and speed ranges should add up to 100%. You take the maximum percentage for each sector and sum to other sectors.
Here is what we got for the collected data:
.png)
Conclusions and further research
Overall, the study underscores the potential of drones in providing a detailed, mobile, and versatile method for wind measurement, offering an effective solution to the restrictions of stationary wind sensors. The findings suggest that such drone-based methodologies greatly benefit industries that require precise wind measurements, ensuring accurate data even in areas previously challenging to monitor.
Future research:
- Collect more data in both flying and hovering modes to better estimate the influence of wind flow generated by the propellers.
- To validate accuracy, compare the drone-based measurements with data from ground truth sensors and meteorological stations.
- Obtain wind data near operational wind turbines and compare the estimated power generation with actual figures.
- Integrate wind data with the Falcon methane detector readings to create a comprehensive plume dispersion map.
- Combine wind data with a methane sniffer to develop a leakage flow rate model that quantifies emission rates.