.webp)
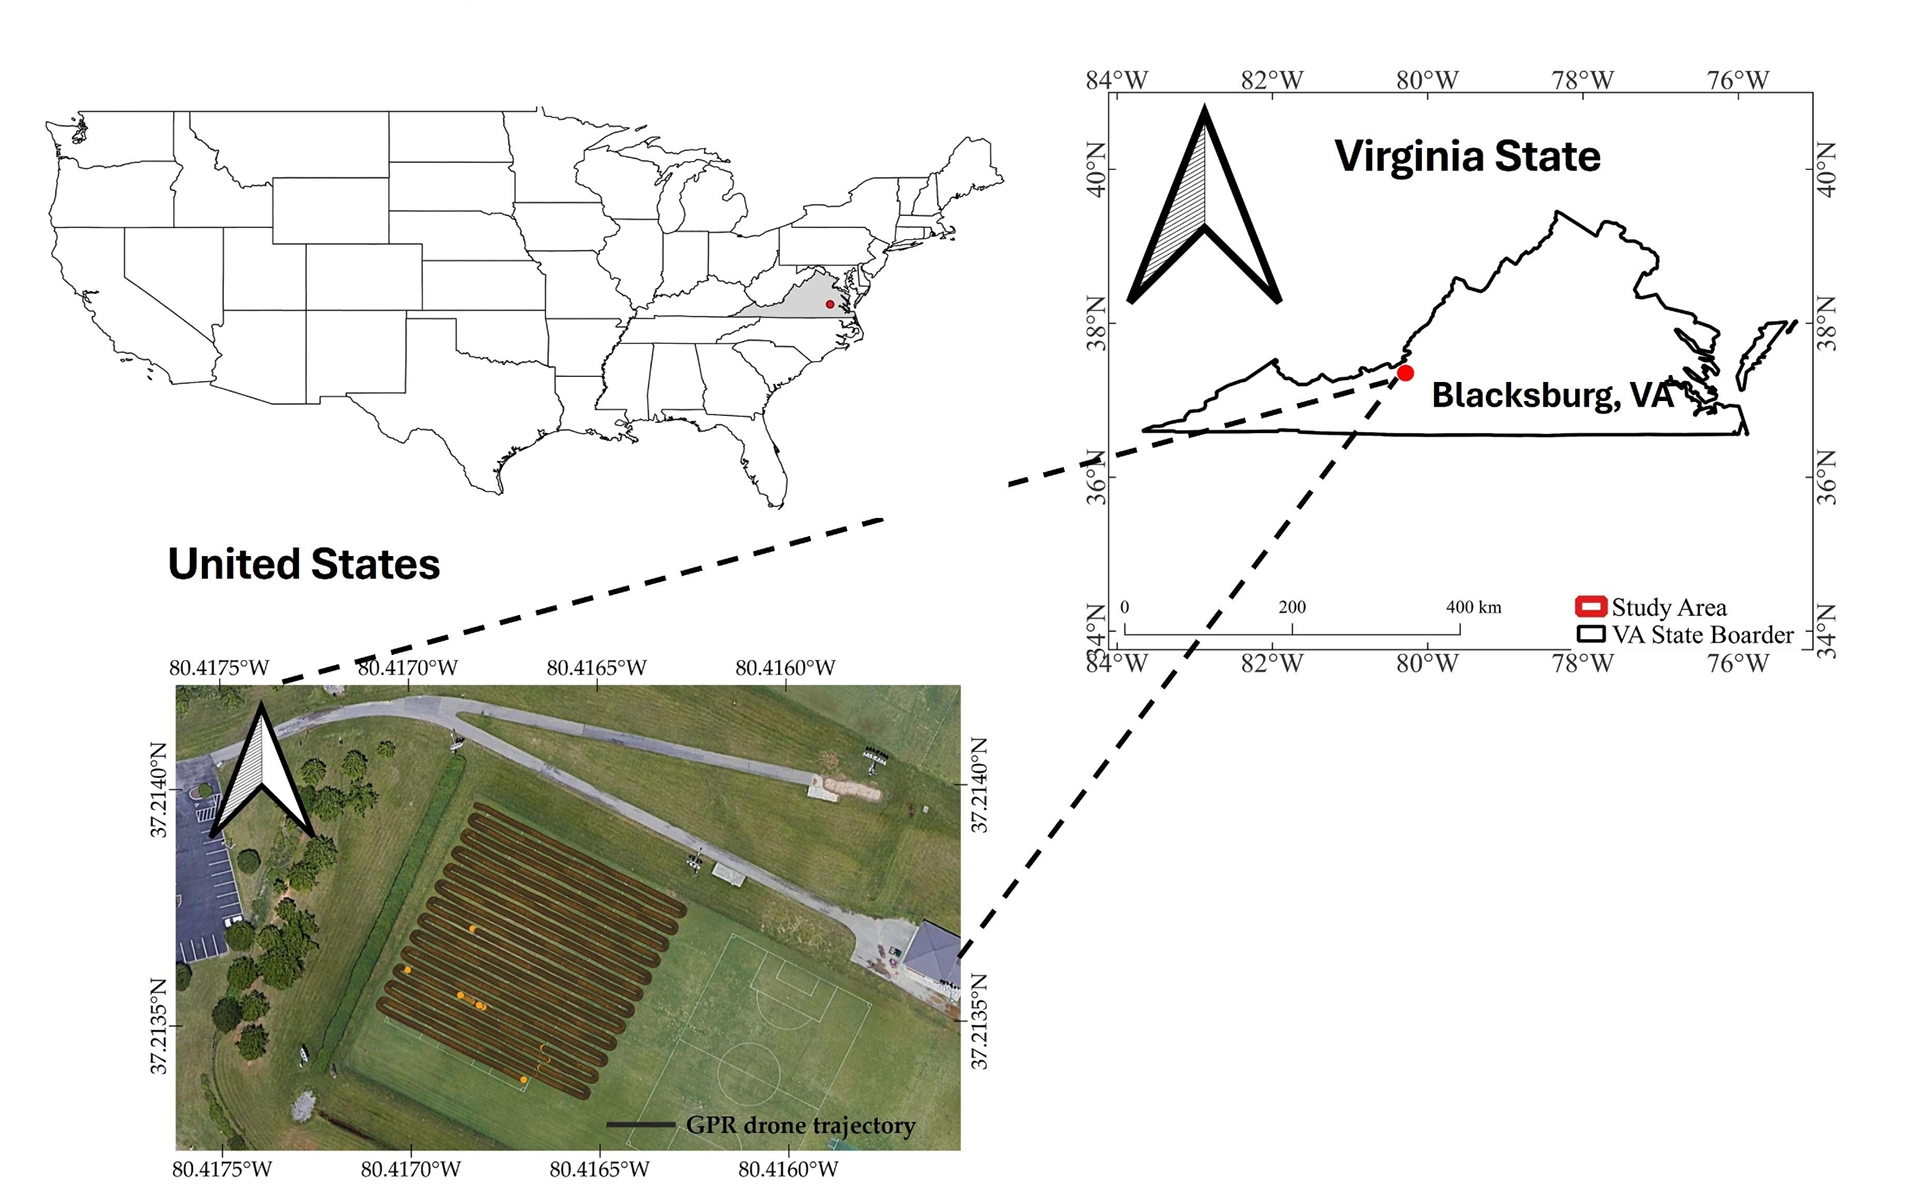
Researchers at Virginia Polytechnic Institute and State University completed seven drone-mounted ground-penetrating radar (GPR) surveys over a maize field in Suffolk, Virginia, between mid-June and late August 2023. The study, published in Sensors (MDPI, March 2026), set out to answer a question the precision agriculture community has been stuck on for years: when a drone GPR signal looks different between two flights, is it the altitude, the terrain, the plants, or the water content driving the change?
The answer required extreme platform stability. To isolate each factor, the research team built their system around UgCS flight planning software, SkyHub with a laser altimeter, and a Zond Aero 500 GPR mounted on a DJI M300. Altitude precision across the campaign came in at a standard deviation of 0.02 m across three programmed flight heights, tight enough to attribute signal variation to environmental factors rather than platform noise.
Mission Summary
Key Results
- Altitude precision of σ = 0.02 m at 1 m, 2 m, and 2.5 m programmed flight heights, validated across seven flights
- Travel time linearity of 6.67 ns/m, matching the theoretical free-space prediction for two-way radar travel time
- Seven drone GPR surveys completed across a full growing season, from early vegetative stage through late senescence
- Approximately 60,000 traces per flight at 1 m/s, with centimeter-scale GNSS-synchronized position logging
- Four isolated experiments quantifying altitude, topography, biomass, and canopy water content effects
The Challenge: Drone GPR in Precision Agriculture Is a Signal Interpretation Problem
Drone-mounted GPR promises something traditional agricultural monitoring can't deliver: non-invasive, high-resolution subsurface data over entire fields, collected in a single flight. In theory, the data can be used to study soil moisture, root-zone structure, and compaction. In practice, air-launched GPR signals are affected by four factors that typically change at the same time during a field campaign:
- Flight altitude changes how strong the return signal is and how long it takes to arrive
- Surface topography can change the actual antenna-to-ground distance if the drone holds a fixed altitude instead of following the terrain
- Vegetation biomass introduces scattering and absorption as plants grow through the season
- Canopy water content shifts the dielectric properties of the vegetation layer, attenuating the signal
Without a way to isolate each factor, it's hard to say what caused any given shift in the data. The Virginia Tech team set out to change that. They needed a platform stable enough to hold all variables constant except one. That required altitude tolerance measured in centimeters, not decimeters, and mission repeatability that held across months of field conditions.
The Solution: A Full UgCS Stack for Controlled Agricultural GPR Research
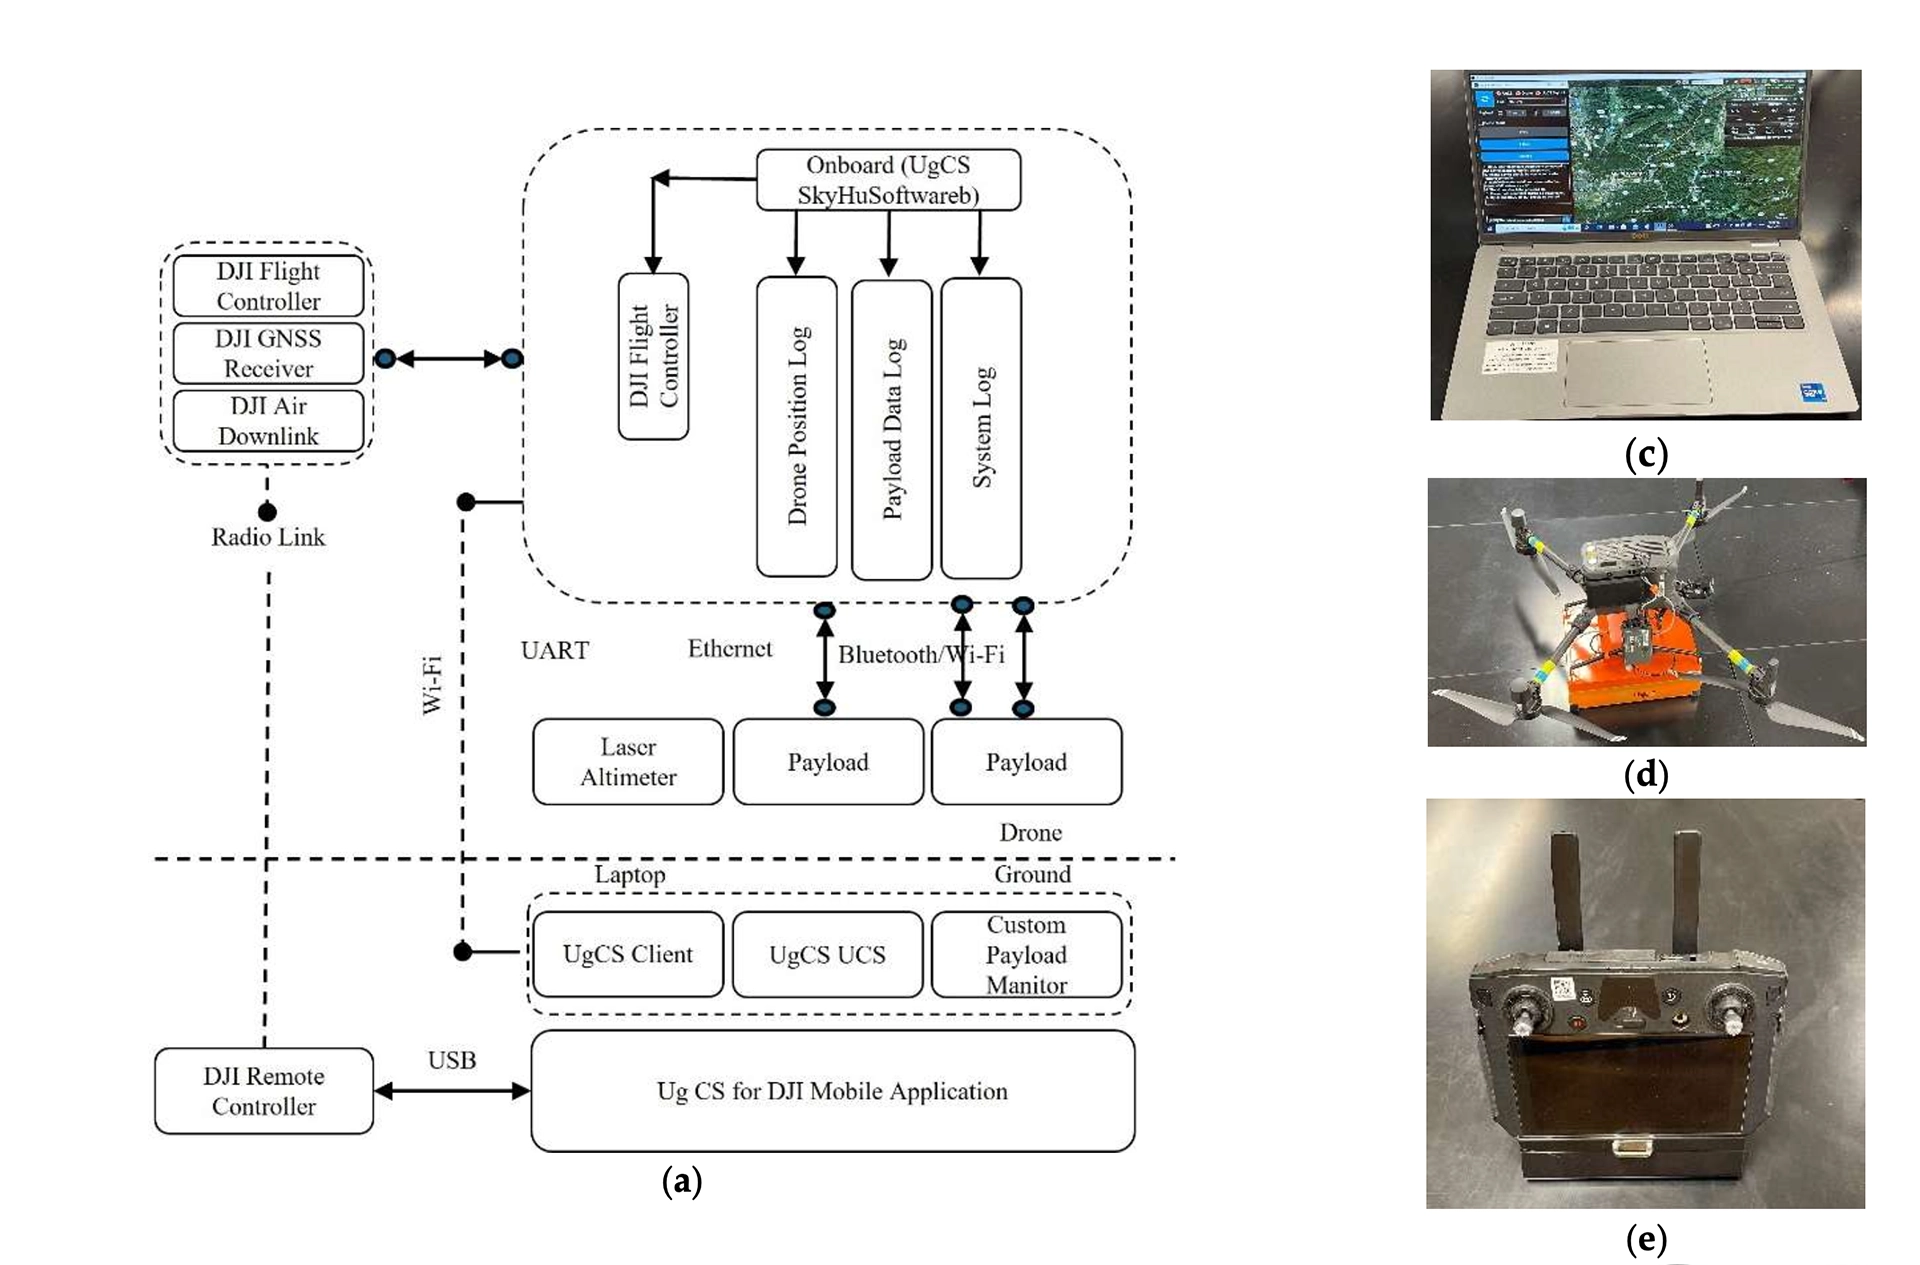
The research team deployed the complete SPH Engineering integration: UgCS on the ground station laptop, SkyHub on the aircraft with a laser altimeter, UgCS for DJI app on the Smart Controller, and a Zond Aero 500 GPR payload. Each component had a specific role.
1. Validated Terrain Following in Real Field Conditions
At the Virginia Tech Athletic Field, the team tested the system at three programmed altitudes: 1 m, 2 m, and 2.5 m above ground level (AGL). Altimeter histograms from every trace in all three flights showed standard deviations of 0.02 m around the target height. Two centimeters across tens of thousands of traces.
How it works: UgCS terrain-following uses onboard altimeter readings to hold the aircraft at a programmed AGL, adjusting continuously as the ground elevation changes beneath the drone. The averaging factor is tunable for different terrain types.
The Impact: Across seven flight dates over the Tidewater cornfield, the team produced a validated altitude reference that let them isolate the effects of everything else. Altitude variance stayed within the tight operational window needed for scientific repeatability across the full summer campaign.
2. UgCS Mission Planning for Row-Parallel Surveys
On the ground station laptop, the team used UgCS to lay out waypoints parallel to the crop rows. Flight speed, altitude, and line spacing were set to match the spatial resolution predicted by the GPR's main-lobe geometry equations, ensuring the footprint at depth covered the 1 m × 1 m validation plots used for ground-truth soil moisture readings.
How it works: UgCS desktop lets operators validate flight boundaries, altitudes, and line spacing against site elevation before leaving the office. For a research mission with hard resolution requirements, this meant the team could verify their flight geometry matched the required ground footprint before any hardware left the shelf.
The Impact: The research paper specifies the exact resolution predictions (footprint radius at surface and at depth, vertical resolution limit) and confirms these dimensions matched the 1 m × 1 m physical sample plots used for ground truth. Mission planning and sensor physics were tied together before the first flight.
3. SkyHub as the Payload Hub
The SkyHub onboard computer, mounted on the drone together with the Zond Aero 500 GPR, served two main purposes.
Firstly, it controls the drone during low-altitude terrain following missions. It receives the automated route from the UgCS ground control station, takes in real-time data from the onboard altimeter mounted on the front of the drone. Using this information it guides the drone on a low-altitude terrain following mission, making it possible to fly as low as a meter above ground during automated GPR surveys.
Second, it records the data. The Zond Aero 500 GPR is directly connected to SkyHub via a wired Ethernet connection. By serving as the bridge between drone autopilot and the GPR sensor, SkyHub is able to merge the drone timestamped GPS position and other telemetry information with the GPR data. The result is SEG-Y data files, which can be opened directly in GPR data processing software like GeoHammer for data analysis after the flight.
The Results: Four Experiments, One Unified Finding
With platform stability established, the team ran four targeted experiments across the 2023 growing season.
Experiment I: Altitude Effect (Bare Turf)
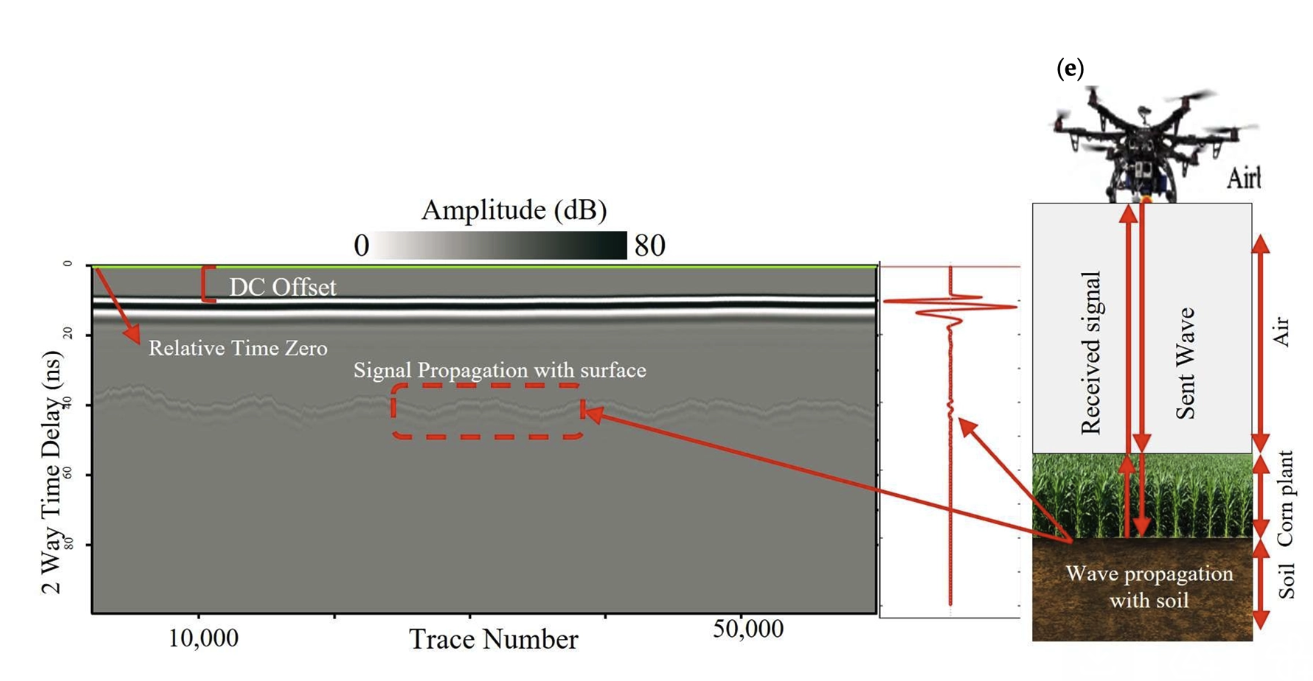
Over the flat, vegetation-free Virginia Tech Athletic Field, three flights at 1 m, 2 m, and 2.5 m AGL produced exactly the signal behavior theory predicted. The two-way travel time to the soil surface followed a linear relationship with altitude at a slope of 6.67 ns per meter, matching the theoretical 2/c value within measurement error. Peak amplitudes decreased with height according to the 1/H geometric spreading law. This experiment provided the baseline for all subsequent calibration.
Experiment II: Topography Effect
Over the Tidewater maize field, flown at a programmed 2.5 m AGL early in the vegetative stage, a 30 cm terrain slope produced measurable two-way travel time shifts in the ground reflection. The onboard altimeter readings correlated precisely with the picked surface arrival times in the radargrams. Spatial maps of altimeter height and envelope amplitude showed visually matching patterns, confirming that terrain-driven altitude variation was detectable and correctable using the SkyHub altimeter data stream.
Experiment III: Biomass Effect
Three flights across 26 days (15 June through 11 July) tracked the corn from about 1.5 m tall to 2.2 m, the rapid-growth phase leading up to tasseling. As plants filled in, GPR signal amplitude dropped and the ground reflection became more diffused. More of the radar energy was scattering off leaves and stems instead of reaching the soil, a pattern the team quantified across the full vegetative growth window.
Experiment IV: Canopy Water Content Effect
Three late-season flights (20 July, 2 August, 21 August) captured the period when plant height had stabilized but canopy water content was declining rapidly. A greenness index tracked from RGB drone imagery dropped sharply from 0.18 to under 0.05 while plant height stayed flat. The GPR signal shifted too, even though the plants themselves had not changed in size. Water content alone produces measurable changes in the radar return.
Importance for Drone GPR in Precision Agriculture
This is the first peer-reviewed study to systematically isolate the four primary drivers of drone GPR signal variation across a full growing season in a real agricultural field. The practical implications are significant for anyone deploying drone GPR commercially in ag:
- Soil moisture mapping needs altitude-corrected signals. The Virginia Tech data provides the calibration coefficients.
- Variable-rate irrigation planning benefits from quantified canopy water content effects, which can now be separated from soil signal.
- Root zone assessment requires understanding how biomass attenuates the subsurface window. The research team mapped this quantitatively across maize growth stages.
The study also validates something SPH Engineering customers already use SkyHub for: real-time altimeter-based terrain following at altitudes low enough to deliver scientific-quality GPR data. Two-centimeter standard deviation across three tested altitudes is a hard specification that researchers and service providers can cite in their own deployments.
From the Researchers
"Integrating drone-based GPR observations with surface spectral and thermal data improved discrimination between soil and vegetation-induced signal distortions."
Vahidi & Shafian, Sensors 2026
Technical Specifications
Citation
Vahidi, M., & Shafian, S. (2026). Evaluating Environmental and Crop Factors Affecting Drone-Mounted GPR Performance in Agricultural Fields. Sensors, 26(6), 1873.
DOI: 10.3390/s26061873
This case study is based on open-access research published under the Creative Commons Attribution (CC BY) license. The original authors, Virginia Polytechnic Institute and State University, and MDPI are credited. No use, distribution, or reproduction is permitted which does not comply with these terms.
SOLUTION USED: UgCS
- UgCS is the professional drone mission planning software behind peer-reviewed research in precision agriculture, planetary science, and geophysics. Pair it with SkyHub for centimeter-level terrain following and integrated payload control across GPR, methane detector, magnetometer, and LiDAR sensors.
- UgCS drone mission planning software
- SkyHub onboard computer for payload integration