
Step 1
In the Upload dialog select Sensor data (csv).

Step 2
In the right panel select Purway for sensor type, then press “+” button and add CSV files collected from the sensor. You may select multiple files simultaneously. But select only files collected on one site. If you have multiple surveys for different sites, create separate project in DroneGIS for each site.

If Step 2 is successful, the software will automatically display the trajectory from the files.

Step 3
For landfill data collected with a drone, clean trajectories from the turn segments, approach, and return home. Use the “Clean” button in the file menu.

Software will automatically extract only trajectory lines from the data. Check the “green” trajectory. If it’s OK, apply changes

If the software missed some segments or highlighted excessive segments, use CTRL+left mouse click to select/deselect segments.
Repeat this operation for each file, they click Next
Step 4
Check the preview. Software automatically filters noise, so the preview should show reliable data. Check leak locations:
- Set a minimal value for the range to the ambient methane level for the inspected site. You can start from 200 ppm * m and then fine-tune. Typically, during data acquisition, it’s recommended to collect data in a place with no methane and use it as a minimal value for post-processing.
- Choose a color palette
- Adjust point radius for better visualization

Then press Next.
Step 5
Software automatically shows points with values within the value range. These points will be added to the resulting emission report. If points are too dense, use ”Merge points within the radius" to merge points which are closer than N meters to each other. This depends on the report requirements and the way you interact with the field team.
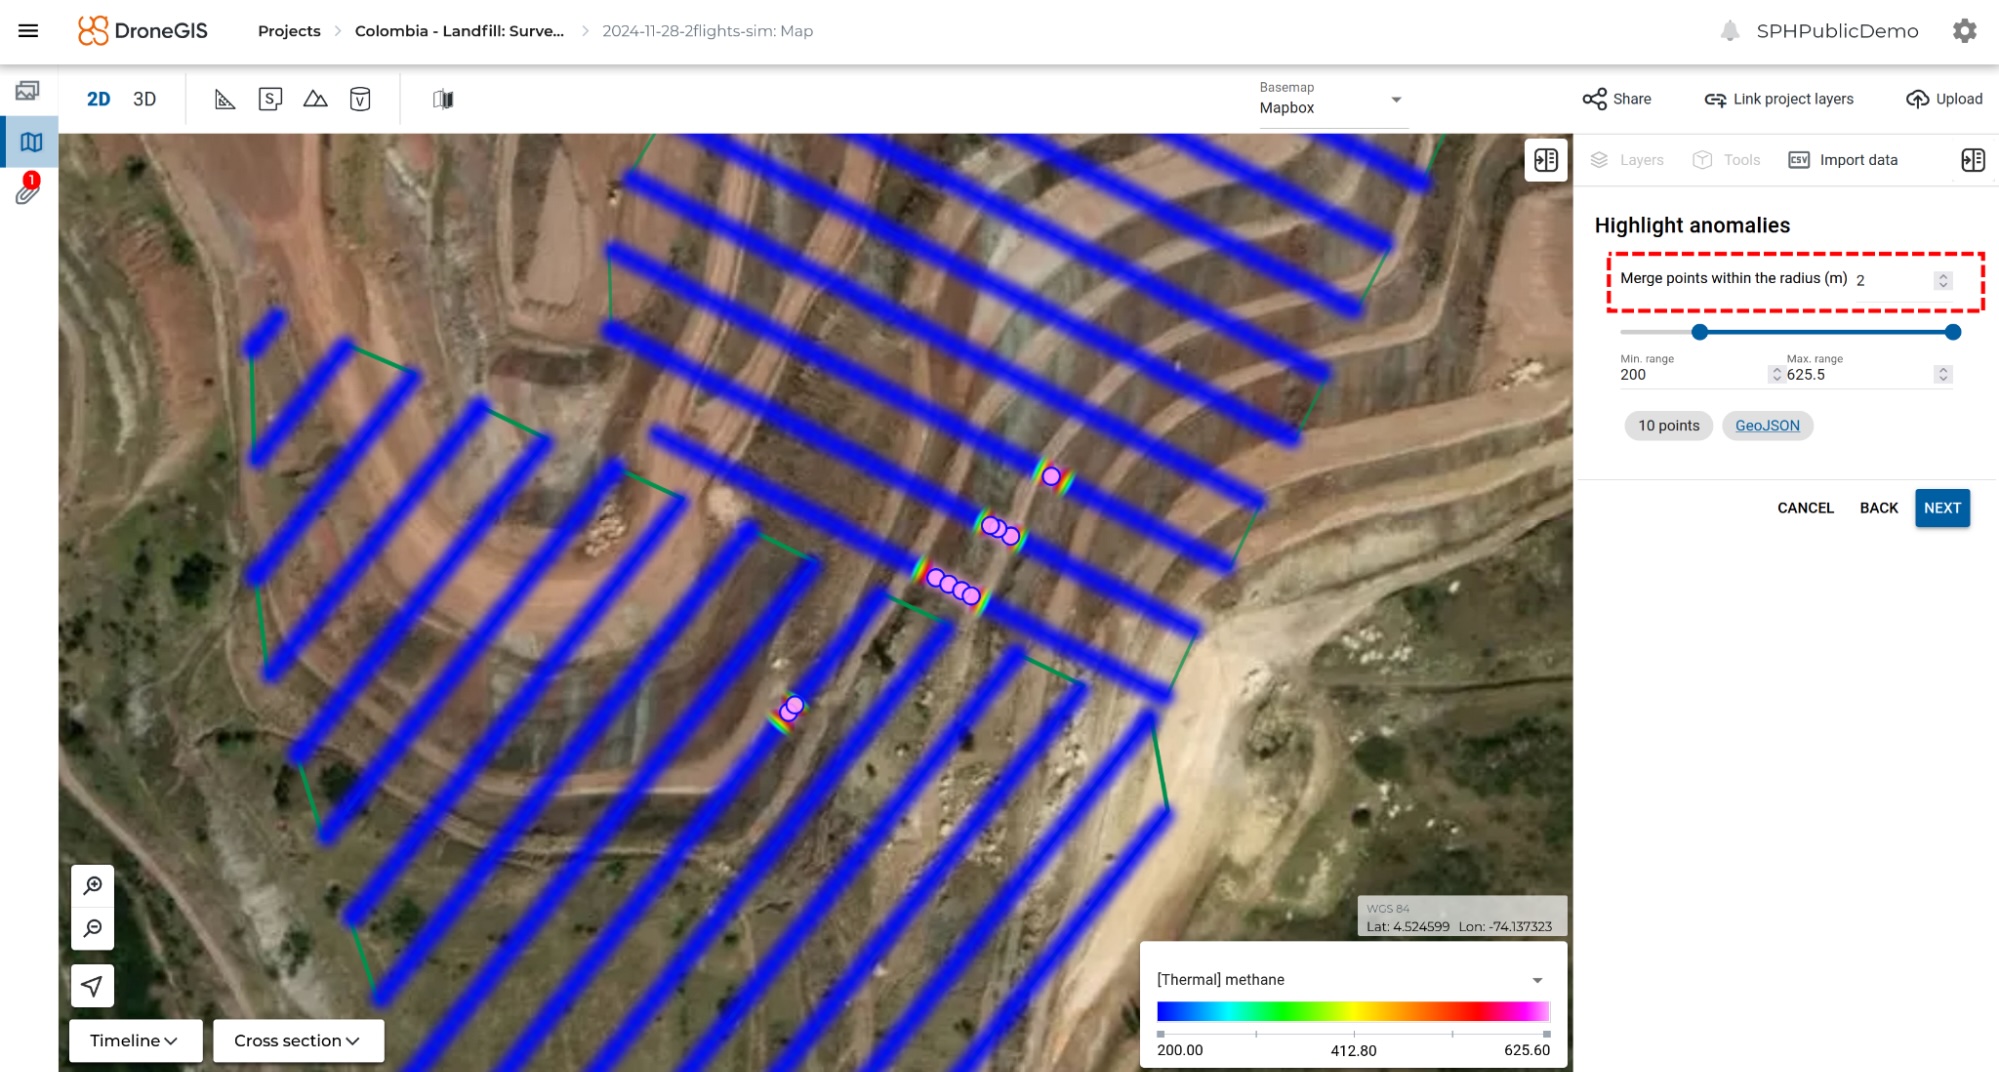
Press “Next."
Step 6
At this step, you can generate reports in MS Word format. Simply click “Export report to DOCX.”

The resulting report will look like this

Optionally, you can save the map and leak locations to the server. To do that, enter the resulting layer name and click “Save results”.

If the checkbox “Generate heatmap” is selected, software will make accurate gridding of your data and generate a thermal map with the same layer name. This emission (thermal) map will contain interpolated data from the original data points.

Now are all set and ready to deliver to your client!